Gradient Boosting Treeを使ってみる - R{gbm} (Part.1)
予測モデリングのコンペで良く使われるらしいGBMを業務で使うことになったので、その使い方メモ。
Rのbgmを使う。
理論的なことは↓をじっくりといつか振り返ることにして、とりあえず使ってみる。
Ridgeway(2012), Generalized Boosted Models: A guide to the gbm package
データはUCIのページより、Adult Data Setというのを使用。
32,562行15列の、3.35Mくらいのデータ。
目的変数がincome_classで、水準が"<=50K"と">50K"の2水準。
よって、2値判別問題のデータ。
説明変数が以下の14変数
age
workclass
fnlwgt
education
education-num
marital-status
occupation
relationship
race
sex
capital-gain
capital-loss
hours-per-week
native-country
カテゴリカル変数で水準数が少ないものは他の水準に統合しておく。
workclass変数(9水準)。
"Never-worked"と"Without-pay"を、"?"と変更。
marital-status変数(7水準)。
"Married-AF-spouse"と"Married-civ-spouse"と"Married-spouse-absent"とを、"Married"と変更。
race変数(5水準)。
"Amer-Indian-Eskimo"を、"Other"と変更。
occupation変数(15水準)。
"Armed-Forces"と"Priv-house-serv"を、"?"と変更。
adult2_0に読み込む。
str(adult2_0)
'data.frame':   32561 obs. of  15 variables:
 $ age           : int  39 50 38 53 28 37 49 52 31 42 ...
 $ workclass     : Factor w/ 7 levels "?","Federal-gov",..: 7 6 4 4 4 4 4 6 4 4 ...
 $ fnlwgt        : int  77516 83311 215646 234721 338409 284582 160187 209642 45781 159449 ...
 $ education     : Factor w/ 16 levels "10th","11th",..: 10 10 12 2 10 13 7 12 13 10 ...
 $ education.num : int  13 13 9 7 13 14 5 9 14 13 ...
 $ marital.status: Factor w/ 5 levels "Divorced","Married",..: 3 2 1 2 2 2 2 2 3 2 ...
 $ occupation    : Factor w/ 13 levels "?","Adm-clerical",..: 2 4 6 6 9 4 8 4 9 4 ...
 $ relationship  : Factor w/ 6 levels "Husband","Not-in-family",..: 2 1 2 1 6 6 2 1 2 1 ...
 $ race          : Factor w/ 4 levels "Asian-Pac-Islander",..: 4 4 4 2 2 4 2 4 4 4 ...
 $ sex           : Factor w/ 2 levels "Female","Male": 2 2 2 2 1 1 1 2 1 2 ...
 $ capital.gain  : int  2174 0 0 0 0 0 0 0 14084 5178 ...
 $ capital.loss  : int  0 0 0 0 0 0 0 0 0 0 ...
 $ hours.per.week: int  40 13 40 40 40 40 16 45 50 40 ...
 $ native.country: Factor w/ 42 levels "?","Cambodia",..: 40 40 40 40 6 40 24 40 40 40 ...
 $ income_class  : Factor w/ 2 levels "<=50K",">50K": 1 1 1 1 1 1 1 2 2 2 ...
目的変数の水準"<=50K"を0、">50K"を1と数値に変換しておく。
icm <- as.numeric(adult2_0$income_class==">50K")
変数名をincomeとする。
adult2_1 <- data.frame(adult2_0, income=icm)
str(adult2_1)
'data.frame':   32561 obs. of  16 variables:
 $ age           : int  39 50 38 53 28 37 49 52 31 42 ...
 $ workclass     : Factor w/ 7 levels "?","Federal-gov",..: 7 6 4 4 4 4 4 6 4 4 ...
 $ fnlwgt        : int  77516 83311 215646 234721 338409 284582 160187 209642 45781 159449 ...
 $ education     : Factor w/ 16 levels "10th","11th",..: 10 10 12 2 10 13 7 12 13 10 ...
 $ education.num : int  13 13 9 7 13 14 5 9 14 13 ...
 $ marital.status: Factor w/ 5 levels "Divorced","Married",..: 3 2 1 2 2 2 2 2 3 2 ...
 $ occupation    : Factor w/ 13 levels "?","Adm-clerical",..: 2 4 6 6 9 4 8 4 9 4 ...
 $ relationship  : Factor w/ 6 levels "Husband","Not-in-family",..: 2 1 2 1 6 6 2 1 2 1 ...
 $ race          : Factor w/ 4 levels "Asian-Pac-Islander",..: 4 4 4 2 2 4 2 4 4 4 ...
 $ sex           : Factor w/ 2 levels "Female","Male": 2 2 2 2 1 1 1 2 1 2 ...
 $ capital.gain  : int  2174 0 0 0 0 0 0 0 14084 5178 ...
 $ capital.loss  : int  0 0 0 0 0 0 0 0 0 0 ...
 $ hours.per.week: int  40 13 40 40 40 40 16 45 50 40 ...
 $ native.country: Factor w/ 42 levels "?","Cambodia",..: 40 40 40 40 6 40 24 40 40 40 ...
 $ income_class  : Factor w/ 2 levels "<=50K",">50K": 1 1 1 1 1 1 1 2 2 2 ...
 $ income        : num  0 0 0 0 0 0 0 1 1 1 ...
incomeが1の割合の確認。
table(adult2_1$income)["1"]/sum(table(adult2_1$income))
0.2408096
学習、検証、テストデータに分けるため、行をシャッフルする。
adult2_2 <- adult2_1[sample(1:nrow(adult2_1)),]
train(学習と検証)、test(テスト)へデータを分割。
nrow(adult2_2) * 0.75
24420.75
trainは1から24420行目までを、24421行目から32561行目までの8141行をtestとする。
train0 <- adult2_2[1:24420,] # 24420 obs. of 16 variables
test0 <- adult2_2[24421:32561,] # 8141 obs. of 16 variables
incomeの割合の確認。
test。
table(train0$income)["1"]/sum(table(train0$income))
0.2410729
train。
table(test0$income)["1"]/sum(table(test0$income))
0.2400197
gbmの実行。
library(gbm)
説明変数と目的変数を分けておく。
x_variables <- train0[,1:14]
target <- train0$income
データの2/3を学習、1/3を検証とする。
for_train <- round(nrow(train0)*0.666)
16264
1行目から16264行目までが学習、残りが検証とgbm.fitでは処理される(たぶん...)。
mod1 <- gbm.fit(
x=x_variables,
y=target,
distribution = "bernoulli",
bag.fraction = 0.5,
n.trees = 5000,
interaction.depth = 7,
n.minobsinnode = 100,
shrinkage = 0.005,
nTrain = for_train
)
実行すると、5000回のイテレーション結果が画面出力される。
distribution:
目的変数が2値(0/1)判別の場合は"bernoulli"と指定。
bag.fraction:
各イテレーションで、オブザベーションの重複無しサンプリングを行う割合。Ridgeway(2012)によると、この処理を行うと、パフォーマンスがけっこう上がるとのこと。
n.tree:
イテレーション回数(合計tree数)。
interaction.depth:
各treeにおける分岐数。
6-8くらい良いとのこと。(同僚よりの情報)
n.minobsinnode:
分岐における最低オブザベーション数(行数)。これより少ないオブザベーショングループができてしまう分岐は行わない、と言うことだと思う。
shrinkage:
学習率。
デフォルトは0.01だが、0.001とか0.005とか小さくしたほうが良いとのこと。(同僚よりの情報)
nTrain:
学習データの行数。1行目からnTrain行までが学習データとなり、残りが検証データとなる。
変数重要度の表示。
summary(mod1)
                          var    rel.inf
relationship     relationship 29.7713982
capital.gain     capital.gain 15.9408432
occupation         occupation 13.5176317
education           education  9.6065983
age                       age  6.0695892
education.num   education.num  5.0654549
native.country native.country  4.8932537
capital.loss     capital.loss  4.1501917
hours.per.week hours.per.week  3.9770395
fnlwgt                 fnlwgt  2.8375266
workclass           workclass  1.9443323
marital.status marital.status  1.7874420
sex                       sex  0.2690007
race                     race  0.1696981
検証データのBernoulli Deviance(Ridgeway(2012)に記載あり)を最小にするTree数が選ばれる。
では、この最適な数のTree数によるモデルで、予測を行う。
学習データの説明変数と目的変数。
x_variables_train <- x_variables[1:16264,] # 先頭から16264行まで
target_train <- target[1:16264]
検証データの説明変数と目的変数。
x_variables_varidation <- x_variables[16265:nrow(x_variables),] # 16265行以降
target_varidation <- target[16265:nrow(x_variables)]
学習データに対する予測値。
pred_mod1_train <- predict(mod1, newdata=x_variables_train, n.trees=gbm.perf(mod1, plot.it=FALSE),
type="response")
検証データに対する予測値。
pred_mod1_varidation <- predict(mod1, newdata=x_variables_varidation, n.trees=gbm.perf(mod1,
plot.it=FALSE), type="response")
テストデータの説明変数と目的変数。
test_x <- test0[,1:14]
test_y <- test0[,16]
テストデータに対する予測値。
pred_mod1_test <- predict(mod1, newdata=test_x, n.trees=gbm.perf(mod1, plot.it=FALSE),
type="response")
AUCを計算する。
gbm.roc.areaという関数があるようだが、ROCのAUCを計算する関数を過去に書いたことがあるので、それを使う。
highschoolstudent.hatenablog.com
ROCRパッケージを読み込み、fn_AUC関数を読んでおく。
############ ROC ############
library(ROCR)
# AUCを返す関数 - pred:予測値, obs:実測値
fn_AUC <- function(pred, obs){
pred1 <- prediction(predictions=pred, labels=obs)
auc.temp <- performance(pred1, "auc")
auc <- unlist(auc.temp@y.values)
return(auc)
}
#############################
学習データのAUC。
fn_AUC(pred=pred_mod1_train, obs=target_train)
0.9344421
検証データのAUC。
fn_AUC(pred=pred_mod1_varidation, obs=target_varidation)
0.9232262
テストデータのAUC。
fn_AUC(pred=pred_mod1_test, obs=test_y)
0.9190125
最後にPartial Dependence Plotを書き、各変数と目的変数の関係を見ておく。
Partial Dependence Plotだが、正式名称かどうかは不明。同僚がそのように呼んでいる。
また、詳しい計算方法も把握してはいない。
ヒストグラム、棒グラフも同時にプロットする関数を定義しておく。
# gbm.plot(partial dependence plot)とhistgram/barplotを並べる関数
# mod_res:gbmの結果, num_trees:Treeの数, var_name:調べる変数名, x_data:元の説明変数が入った data.frame
fn_plot_gbm <- function(mod_res, num_trees, var_name, x_data){
if(class(x_data[,var_name]) %in% c("numeric","integer")) { # histの場合
par(mfrow=c(2,1))
plot(mod_res, i.var=var_name, ntrees=num_trees , type="response")
hist(x_data[,var_name])
} else if(class(x_data[,var_name])=="factor") { # barplotの場合
par(mfrow=c(2,1))
plot(mod_res, i.var=var_name, ntrees=num_trees , type="response")
barplot(table(x_data[,var_name]), las=3)
} else {
stop("variable class must be numeric or factor.")
}
par(mfrow=c(1,1))
}
このプロットを見て、学習データのノイズに過剰に反応して、オーバーフィッティングが起きていないか調べる。
1) age(数値)
fn_plot_gbm(mod_res=mod1, num_trees=gbm.perf(mod1, plot.it=FALSE), var_name="age", x_data=x_variables)
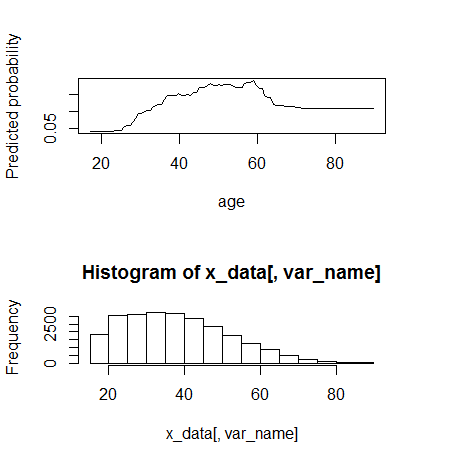
60まではmonotone increaseに見える。60くらいから動きが変わる。
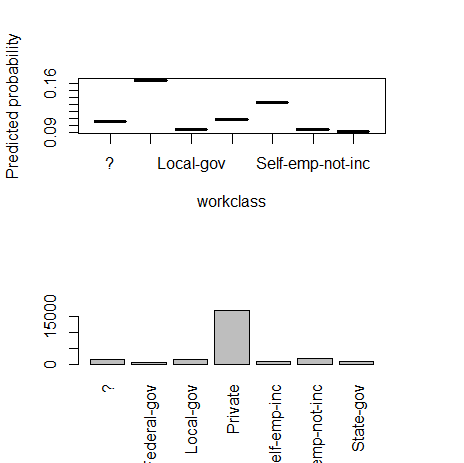
2) workclass(カテゴリー)
fn_plot_gbm(mod_res=mod1, num_trees=gbm.perf(mod1, plot.it=FALSE), var_name="workclass", x_data=x_variables)
3) fnlwgt(数値)
fn_plot_gbm(mod_res=mod1, num_trees=gbm.perf(mod1, plot.it=FALSE), var_name="fnlwgt", x_data=x_variables)
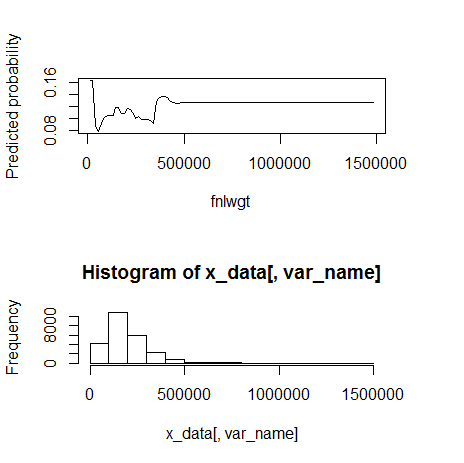
500000くらいを境に外れ値。
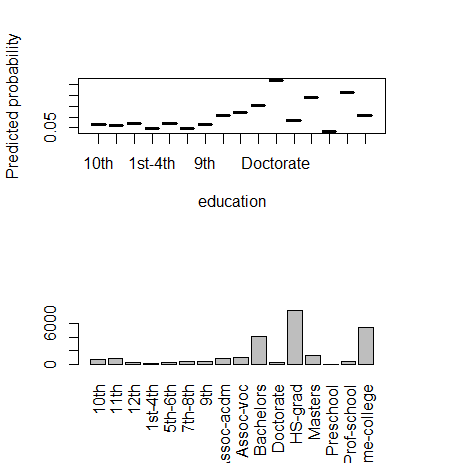
4) education(カテゴリー)
fn_plot_gbm(mod_res=mod1, num_trees=gbm.perf(mod1, plot.it=FALSE), var_name="education", x_data=x_variables)
5) education.num(数値)
fn_plot_gbm(mod_res=mod1, num_trees=gbm.perf(mod1, plot.it=FALSE), var_name="education.num", x_data=x_variables)
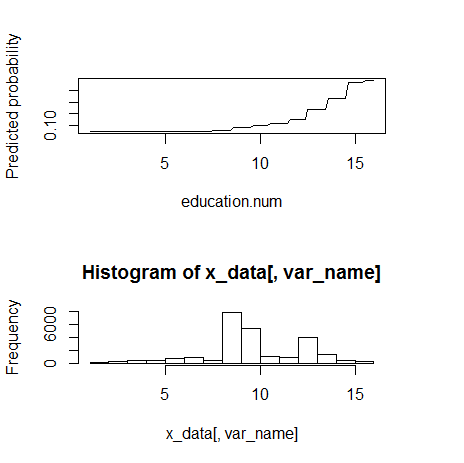
monotone increasingのようである。
6) marital.status(カテゴリー)
fn_plot_gbm(mod_res=mod1, num_trees=gbm.perf(mod1, plot.it=FALSE), var_name="marital.status", x_data=x_variables)
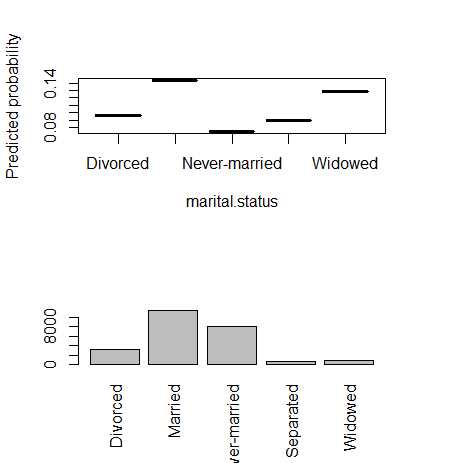
7) occupation(カテゴリー)
fn_plot_gbm(mod_res=mod1, num_trees=gbm.perf(mod1, plot.it=FALSE), var_name="occupation", x_data=x_variables)
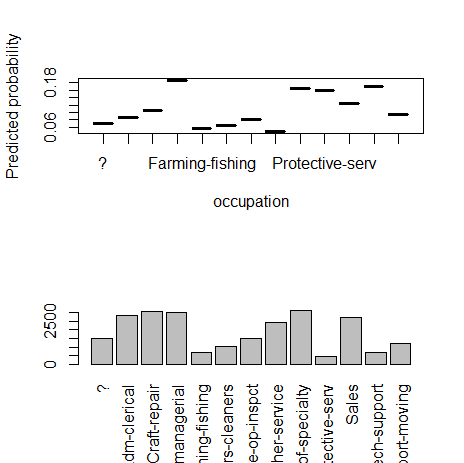
8) relationship(カテゴリー)
fn_plot_gbm(mod_res=mod1, num_trees=gbm.perf(mod1, plot.it=FALSE), var_name="relationship", x_data=x_variables)
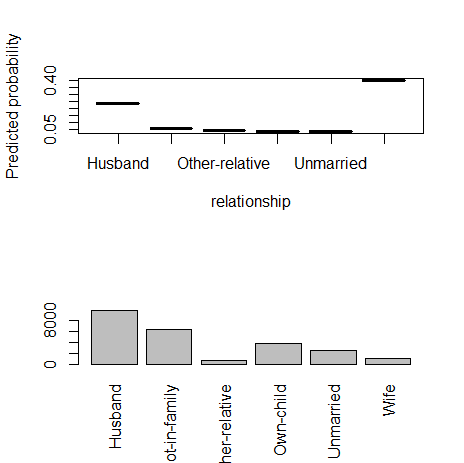
9) race(カテゴリー)
fn_plot_gbm(mod_res=mod1, num_trees=gbm.perf(mod1, plot.it=FALSE), var_name="race", x_data=x_variables)

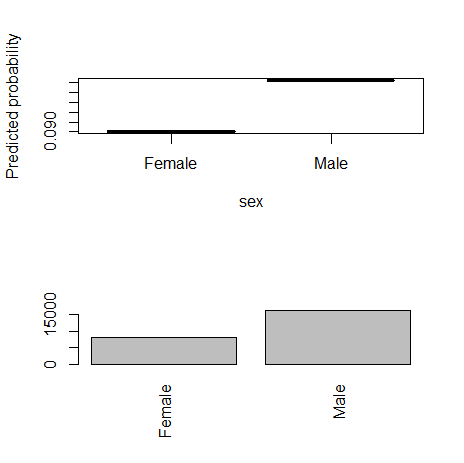
10) sex(カテゴリー)
fn_plot_gbm(mod_res=mod1, num_trees=gbm.perf(mod1, plot.it=FALSE), var_name="sex", x_data=x_variables)
11) capital.gain(数値)
fn_plot_gbm(mod_res=mod1, num_trees=gbm.perf(mod1, plot.it=FALSE), var_name="capital.gain", x_data=x_variables)
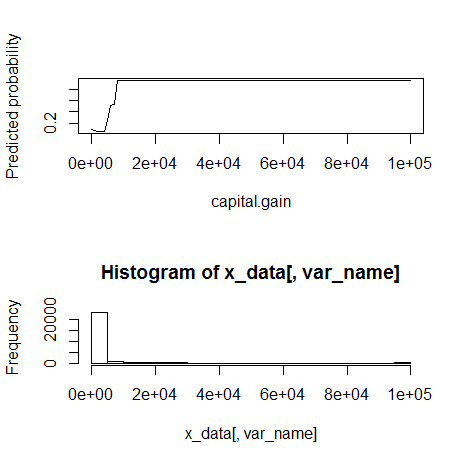
10000くらいを境に外れ値。monotone increasingに見える。
12) capital.loss(数値)
fn_plot_gbm(mod_res=mod1, num_trees=gbm.perf(mod1, plot.it=FALSE), var_name="capital.loss", x_data=x_variables)

元の変数の意味自体が不明で残念であるが、1500から2000くらいの間で急に反応が起こる。
13) hours.per.week(数値)
fn_plot_gbm(mod_res=mod1, num_trees=gbm.perf(mod1, plot.it=FALSE), var_name="hours.per.week", x_data=x_variables)
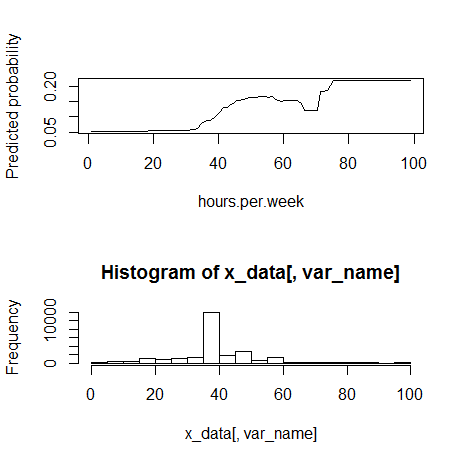
80くらいの境で外れ値。monotone increasingっぽく見える。
14) native.country(カテゴリー)
fn_plot_gbm(mod_res=mod1, num_trees=gbm.perf(mod1, plot.it=FALSE), var_name="native.country", x_data=x_variables)
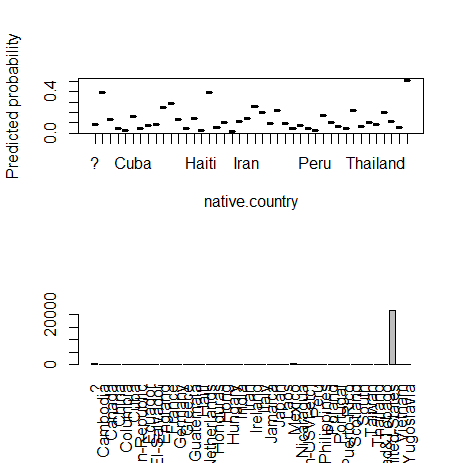
カテゴリカル変数の多水準問題(High Cardinality Problemと同僚は呼んでいる)。
学習データにおいて、沢山水準があるなかで、たまたまいずれかの水準の影響が大きくなってしまい、オーバーフィッテングを起こす可能性がある。
国内のデータを扱っていても、都道府県をそのまま扱うか迷うときがある。
何らかの方法で数値型変数に変換して、説明変数に入れるのが良いとのこと。(同僚曰く)
次回は、Partial Dependence Plotで気づいたことを元に、いくつかの説明変数の変換方法を試してみる。