Gradient Boosting Treeを使ってみる - R{gbm} (Part.1)
予測モデリングのコンペで良く使われるらしいGBMを業務で使うことになったので、その使い方メモ。
Rのbgmを使う。
理論的なことは↓をじっくりといつか振り返ることにして、とりあえず使ってみる。
Ridgeway(2012), Generalized Boosted Models: A guide to the gbm package
データはUCIのページより、Adult Data Setというのを使用。
32,562行15列の、3.35Mくらいのデータ。
目的変数がincome_classで、水準が"<=50K"と">50K"の2水準。
よって、2値判別問題のデータ。
説明変数が以下の14変数
age
workclass
fnlwgt
education
education-num
marital-status
occupation
relationship
race
sex
capital-gain
capital-loss
hours-per-week
native-country
カテゴリカル変数で水準数が少ないものは他の水準に統合しておく。
workclass変数(9水準)。
"Never-worked"と"Without-pay"を、"?"と変更。
marital-status変数(7水準)。
"Married-AF-spouse"と"Married-civ-spouse"と"Married-spouse-absent"とを、"Married"と変更。
race変数(5水準)。
"Amer-Indian-Eskimo"を、"Other"と変更。
occupation変数(15水準)。
"Armed-Forces"と"Priv-house-serv"を、"?"と変更。
adult2_0に読み込む。
str(adult2_0)
'data.frame':   32561 obs. of  15 variables:
 $ age           : int  39 50 38 53 28 37 49 52 31 42 ...
 $ workclass     : Factor w/ 7 levels "?","Federal-gov",..: 7 6 4 4 4 4 4 6 4 4 ...
 $ fnlwgt        : int  77516 83311 215646 234721 338409 284582 160187 209642 45781 159449 ...
 $ education     : Factor w/ 16 levels "10th","11th",..: 10 10 12 2 10 13 7 12 13 10 ...
 $ education.num : int  13 13 9 7 13 14 5 9 14 13 ...
 $ marital.status: Factor w/ 5 levels "Divorced","Married",..: 3 2 1 2 2 2 2 2 3 2 ...
 $ occupation    : Factor w/ 13 levels "?","Adm-clerical",..: 2 4 6 6 9 4 8 4 9 4 ...
 $ relationship  : Factor w/ 6 levels "Husband","Not-in-family",..: 2 1 2 1 6 6 2 1 2 1 ...
 $ race          : Factor w/ 4 levels "Asian-Pac-Islander",..: 4 4 4 2 2 4 2 4 4 4 ...
 $ sex           : Factor w/ 2 levels "Female","Male": 2 2 2 2 1 1 1 2 1 2 ...
 $ capital.gain  : int  2174 0 0 0 0 0 0 0 14084 5178 ...
 $ capital.loss  : int  0 0 0 0 0 0 0 0 0 0 ...
 $ hours.per.week: int  40 13 40 40 40 40 16 45 50 40 ...
 $ native.country: Factor w/ 42 levels "?","Cambodia",..: 40 40 40 40 6 40 24 40 40 40 ...
 $ income_class  : Factor w/ 2 levels "<=50K",">50K": 1 1 1 1 1 1 1 2 2 2 ...
目的変数の水準"<=50K"を0、">50K"を1と数値に変換しておく。
icm <- as.numeric(adult2_0$income_class==">50K")
変数名をincomeとする。
adult2_1 <- data.frame(adult2_0, income=icm)
str(adult2_1)
'data.frame':   32561 obs. of  16 variables:
 $ age           : int  39 50 38 53 28 37 49 52 31 42 ...
 $ workclass     : Factor w/ 7 levels "?","Federal-gov",..: 7 6 4 4 4 4 4 6 4 4 ...
 $ fnlwgt        : int  77516 83311 215646 234721 338409 284582 160187 209642 45781 159449 ...
 $ education     : Factor w/ 16 levels "10th","11th",..: 10 10 12 2 10 13 7 12 13 10 ...
 $ education.num : int  13 13 9 7 13 14 5 9 14 13 ...
 $ marital.status: Factor w/ 5 levels "Divorced","Married",..: 3 2 1 2 2 2 2 2 3 2 ...
 $ occupation    : Factor w/ 13 levels "?","Adm-clerical",..: 2 4 6 6 9 4 8 4 9 4 ...
 $ relationship  : Factor w/ 6 levels "Husband","Not-in-family",..: 2 1 2 1 6 6 2 1 2 1 ...
 $ race          : Factor w/ 4 levels "Asian-Pac-Islander",..: 4 4 4 2 2 4 2 4 4 4 ...
 $ sex           : Factor w/ 2 levels "Female","Male": 2 2 2 2 1 1 1 2 1 2 ...
 $ capital.gain  : int  2174 0 0 0 0 0 0 0 14084 5178 ...
 $ capital.loss  : int  0 0 0 0 0 0 0 0 0 0 ...
 $ hours.per.week: int  40 13 40 40 40 40 16 45 50 40 ...
 $ native.country: Factor w/ 42 levels "?","Cambodia",..: 40 40 40 40 6 40 24 40 40 40 ...
 $ income_class  : Factor w/ 2 levels "<=50K",">50K": 1 1 1 1 1 1 1 2 2 2 ...
 $ income        : num  0 0 0 0 0 0 0 1 1 1 ...
incomeが1の割合の確認。
table(adult2_1$income)["1"]/sum(table(adult2_1$income))
0.2408096
学習、検証、テストデータに分けるため、行をシャッフルする。
adult2_2 <- adult2_1[sample(1:nrow(adult2_1)),]
train(学習と検証)、test(テスト)へデータを分割。
nrow(adult2_2) * 0.75
24420.75
trainは1から24420行目までを、24421行目から32561行目までの8141行をtestとする。
train0 <- adult2_2[1:24420,] # 24420 obs. of 16 variables
test0 <- adult2_2[24421:32561,] # 8141 obs. of 16 variables
incomeの割合の確認。
test。
table(train0$income)["1"]/sum(table(train0$income))
0.2410729
train。
table(test0$income)["1"]/sum(table(test0$income))
0.2400197
gbmの実行。
library(gbm)
説明変数と目的変数を分けておく。
x_variables <- train0[,1:14]
target <- train0$income
データの2/3を学習、1/3を検証とする。
for_train <- round(nrow(train0)*0.666)
16264
1行目から16264行目までが学習、残りが検証とgbm.fitでは処理される(たぶん...)。
mod1 <- gbm.fit(
x=x_variables,
y=target,
distribution = "bernoulli",
bag.fraction = 0.5,
n.trees = 5000,
interaction.depth = 7,
n.minobsinnode = 100,
shrinkage = 0.005,
nTrain = for_train
)
実行すると、5000回のイテレーション結果が画面出力される。
distribution:
目的変数が2値(0/1)判別の場合は"bernoulli"と指定。
bag.fraction:
各イテレーションで、オブザベーションの重複無しサンプリングを行う割合。Ridgeway(2012)によると、この処理を行うと、パフォーマンスがけっこう上がるとのこと。
n.tree:
イテレーション回数(合計tree数)。
interaction.depth:
各treeにおける分岐数。
6-8くらい良いとのこと。(同僚よりの情報)
n.minobsinnode:
分岐における最低オブザベーション数(行数)。これより少ないオブザベーショングループができてしまう分岐は行わない、と言うことだと思う。
shrinkage:
学習率。
デフォルトは0.01だが、0.001とか0.005とか小さくしたほうが良いとのこと。(同僚よりの情報)
nTrain:
学習データの行数。1行目からnTrain行までが学習データとなり、残りが検証データとなる。
変数重要度の表示。
summary(mod1)
                          var    rel.inf
relationship     relationship 29.7713982
capital.gain     capital.gain 15.9408432
occupation         occupation 13.5176317
education           education  9.6065983
age                       age  6.0695892
education.num   education.num  5.0654549
native.country native.country  4.8932537
capital.loss     capital.loss  4.1501917
hours.per.week hours.per.week  3.9770395
fnlwgt                 fnlwgt  2.8375266
workclass           workclass  1.9443323
marital.status marital.status  1.7874420
sex                       sex  0.2690007
race                     race  0.1696981
検証データのBernoulli Deviance(Ridgeway(2012)に記載あり)を最小にするTree数が選ばれる。
では、この最適な数のTree数によるモデルで、予測を行う。
学習データの説明変数と目的変数。
x_variables_train <- x_variables[1:16264,] # 先頭から16264行まで
target_train <- target[1:16264]
検証データの説明変数と目的変数。
x_variables_varidation <- x_variables[16265:nrow(x_variables),] # 16265行以降
target_varidation <- target[16265:nrow(x_variables)]
学習データに対する予測値。
pred_mod1_train <- predict(mod1, newdata=x_variables_train, n.trees=gbm.perf(mod1, plot.it=FALSE),
type="response")
検証データに対する予測値。
pred_mod1_varidation <- predict(mod1, newdata=x_variables_varidation, n.trees=gbm.perf(mod1,
plot.it=FALSE), type="response")
テストデータの説明変数と目的変数。
test_x <- test0[,1:14]
test_y <- test0[,16]
テストデータに対する予測値。
pred_mod1_test <- predict(mod1, newdata=test_x, n.trees=gbm.perf(mod1, plot.it=FALSE),
type="response")
AUCを計算する。
gbm.roc.areaという関数があるようだが、ROCのAUCを計算する関数を過去に書いたことがあるので、それを使う。
highschoolstudent.hatenablog.com
ROCRパッケージを読み込み、fn_AUC関数を読んでおく。
############ ROC ############
library(ROCR)
# AUCを返す関数 - pred:予測値, obs:実測値
fn_AUC <- function(pred, obs){
pred1 <- prediction(predictions=pred, labels=obs)
auc.temp <- performance(pred1, "auc")
auc <- unlist(auc.temp@y.values)
return(auc)
}
#############################
学習データのAUC。
fn_AUC(pred=pred_mod1_train, obs=target_train)
0.9344421
検証データのAUC。
fn_AUC(pred=pred_mod1_varidation, obs=target_varidation)
0.9232262
テストデータのAUC。
fn_AUC(pred=pred_mod1_test, obs=test_y)
0.9190125
最後にPartial Dependence Plotを書き、各変数と目的変数の関係を見ておく。
Partial Dependence Plotだが、正式名称かどうかは不明。同僚がそのように呼んでいる。
また、詳しい計算方法も把握してはいない。
ヒストグラム、棒グラフも同時にプロットする関数を定義しておく。
# gbm.plot(partial dependence plot)とhistgram/barplotを並べる関数
# mod_res:gbmの結果, num_trees:Treeの数, var_name:調べる変数名, x_data:元の説明変数が入った data.frame
fn_plot_gbm <- function(mod_res, num_trees, var_name, x_data){
if(class(x_data[,var_name]) %in% c("numeric","integer")) { # histの場合
par(mfrow=c(2,1))
plot(mod_res, i.var=var_name, ntrees=num_trees , type="response")
hist(x_data[,var_name])
} else if(class(x_data[,var_name])=="factor") { # barplotの場合
par(mfrow=c(2,1))
plot(mod_res, i.var=var_name, ntrees=num_trees , type="response")
barplot(table(x_data[,var_name]), las=3)
} else {
stop("variable class must be numeric or factor.")
}
par(mfrow=c(1,1))
}
このプロットを見て、学習データのノイズに過剰に反応して、オーバーフィッティングが起きていないか調べる。
1) age(数値)
fn_plot_gbm(mod_res=mod1, num_trees=gbm.perf(mod1, plot.it=FALSE), var_name="age", x_data=x_variables)
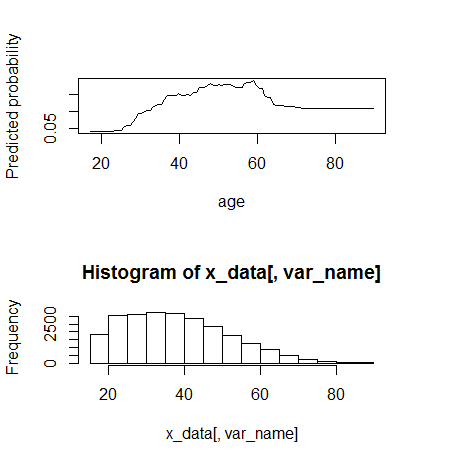
60まではmonotone increaseに見える。60くらいから動きが変わる。
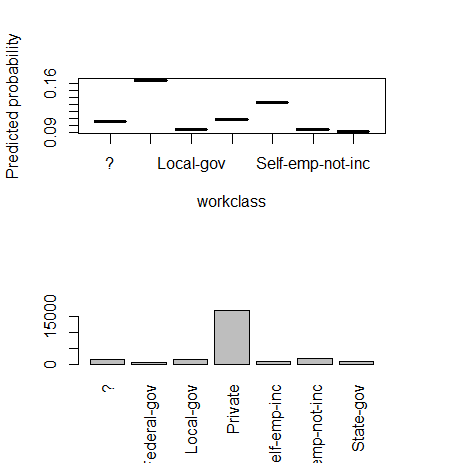
2) workclass(カテゴリー)
fn_plot_gbm(mod_res=mod1, num_trees=gbm.perf(mod1, plot.it=FALSE), var_name="workclass", x_data=x_variables)
3) fnlwgt(数値)
fn_plot_gbm(mod_res=mod1, num_trees=gbm.perf(mod1, plot.it=FALSE), var_name="fnlwgt", x_data=x_variables)
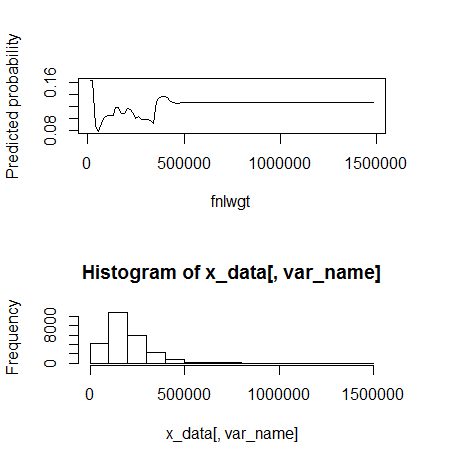
500000くらいを境に外れ値。
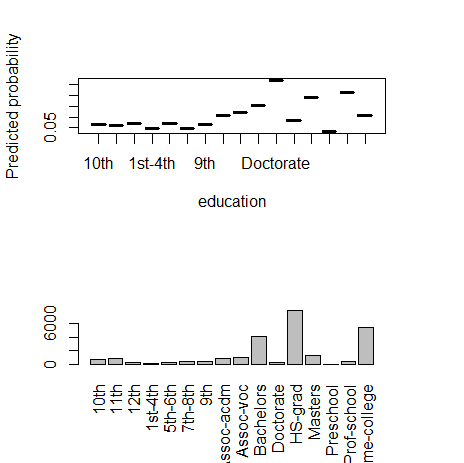
4) education(カテゴリー)
fn_plot_gbm(mod_res=mod1, num_trees=gbm.perf(mod1, plot.it=FALSE), var_name="education", x_data=x_variables)
5) education.num(数値)
fn_plot_gbm(mod_res=mod1, num_trees=gbm.perf(mod1, plot.it=FALSE), var_name="education.num", x_data=x_variables)
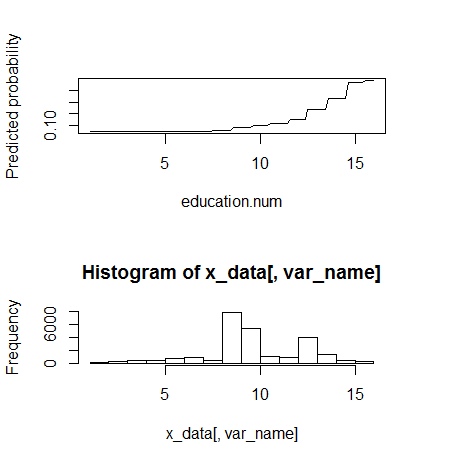
monotone increasingのようである。
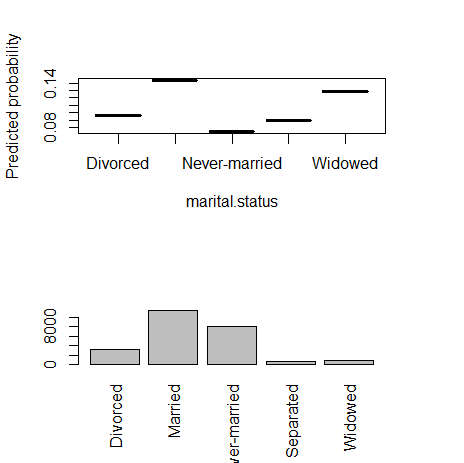
6) marital.status(カテゴリー)
fn_plot_gbm(mod_res=mod1, num_trees=gbm.perf(mod1, plot.it=FALSE), var_name="marital.status", x_data=x_variables)
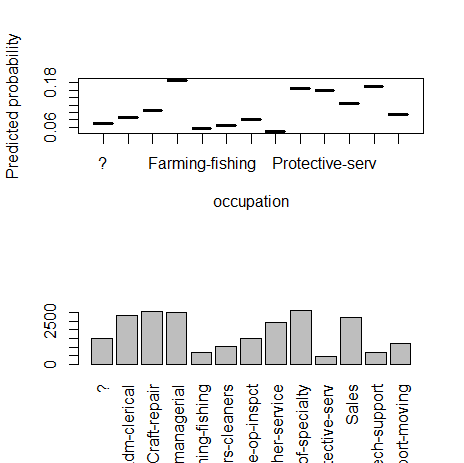
7) occupation(カテゴリー)
fn_plot_gbm(mod_res=mod1, num_trees=gbm.perf(mod1, plot.it=FALSE), var_name="occupation", x_data=x_variables)
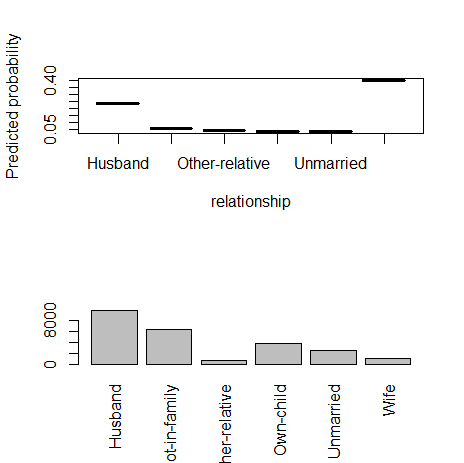
8) relationship(カテゴリー)
fn_plot_gbm(mod_res=mod1, num_trees=gbm.perf(mod1, plot.it=FALSE), var_name="relationship", x_data=x_variables)
9) race(カテゴリー)
fn_plot_gbm(mod_res=mod1, num_trees=gbm.perf(mod1, plot.it=FALSE), var_name="race", x_data=x_variables)

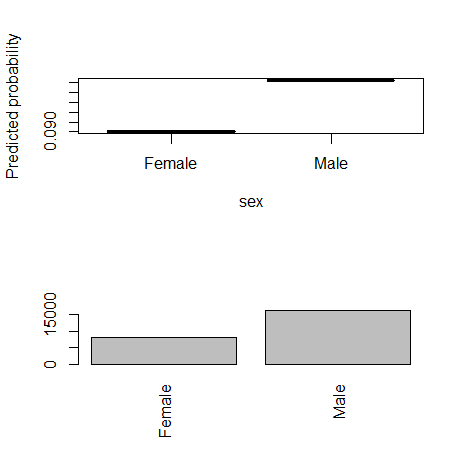
10) sex(カテゴリー)
fn_plot_gbm(mod_res=mod1, num_trees=gbm.perf(mod1, plot.it=FALSE), var_name="sex", x_data=x_variables)
11) capital.gain(数値)
fn_plot_gbm(mod_res=mod1, num_trees=gbm.perf(mod1, plot.it=FALSE), var_name="capital.gain", x_data=x_variables)
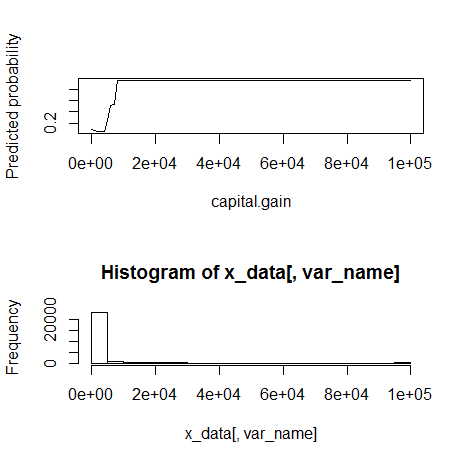
10000くらいを境に外れ値。monotone increasingに見える。
12) capital.loss(数値)
fn_plot_gbm(mod_res=mod1, num_trees=gbm.perf(mod1, plot.it=FALSE), var_name="capital.loss", x_data=x_variables)

元の変数の意味自体が不明で残念であるが、1500から2000くらいの間で急に反応が起こる。
13) hours.per.week(数値)
fn_plot_gbm(mod_res=mod1, num_trees=gbm.perf(mod1, plot.it=FALSE), var_name="hours.per.week", x_data=x_variables)
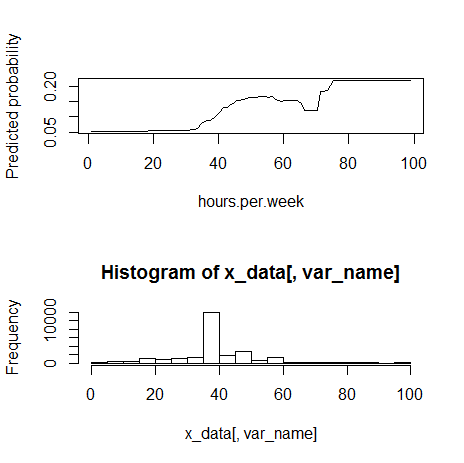
80くらいの境で外れ値。monotone increasingっぽく見える。
14) native.country(カテゴリー)
fn_plot_gbm(mod_res=mod1, num_trees=gbm.perf(mod1, plot.it=FALSE), var_name="native.country", x_data=x_variables)
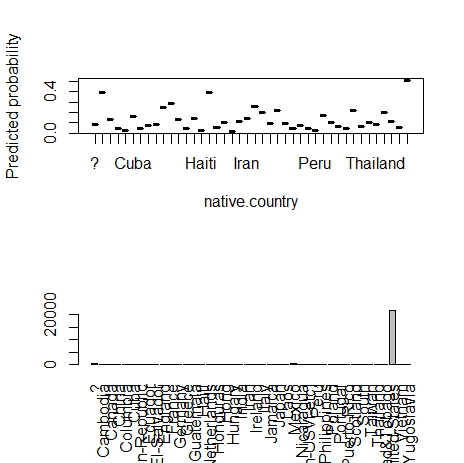
カテゴリカル変数の多水準問題(High Cardinality Problemと同僚は呼んでいる)。
学習データにおいて、沢山水準があるなかで、たまたまいずれかの水準の影響が大きくなってしまい、オーバーフィッテングを起こす可能性がある。
国内のデータを扱っていても、都道府県をそのまま扱うか迷うときがある。
何らかの方法で数値型変数に変換して、説明変数に入れるのが良いとのこと。(同僚曰く)
次回は、Partial Dependence Plotで気づいたことを元に、いくつかの説明変数の変換方法を試してみる。
モデル評価基準 追加 - リフトチャートに関して1 - R{ROCR}
前回の「モデル評価基準 - ROCに関して - R{ROCR}」に関する追加。
highschoolstudent.hatenablog.com
リフトチャート/Lift Chartを描いてみる。
今回書く形式のリフトチャートは、累積反応曲線/Cumulative Response Curveと呼ばれることもあるようである。
ROCとの違いは、縦軸は真陽性率/True Positive Rate(TPR)と同じままだが、横軸を陽性予測率/Positive Prediction Rateとする。
データの読み込み。
d_roc1 <- read.delim("clipboard", header=TRUE)
d_roc1
ROCRパッケージのロード。
library(ROCR)
リフトチャートを描く際は、performance()関数の引数をx.measure="rpp"とする。
perf_p1 <- performance(pred_p1, measure="tpr", x.measure="rpp")
#rpp: Rate of positive predictions. (TP+FP)/(TP+FP+TN+FN).
ROCを書いた手順で、この関数部分を入れ替えればいいだけである。
データテーブルにまとめておく。
table_p1 <- data.frame(Cutoff=unlist(pred_p1@cutoffs),
TP=unlist(pred_p1@tp), FP=unlist(pred_p1@fp),
FN=unlist(pred_p1@fn), TN=unlist(pred_p1@tn),
TPR=unlist(perf_p1@y.values), PosPredR=unlist(perf_p1@x.values),
MissClasR=(unlist(pred_p1@fp)+unlist(pred_p1@fn)) / (unlist(pred_p1@tp)+unlist(pred_p1@fp)+unlist(pred_p1@fn)+unlist(pred_p1@tn))
)
   Cutoff TP FP FN TN TPR   PosPredR MissClasR
1     Inf  0  0  5 14 0.0 0.00000000 0.2631579
2    0.95  1  0  4 14 0.2 0.05263158 0.2105263
3    0.90  2  0  3 14 0.4 0.10526316 0.1578947
4    0.85  2  1  3 13 0.4 0.15789474 0.2105263
5    0.80  3  1  2 13 0.6 0.21052632 0.1578947
6    0.75  3  2  2 12 0.6 0.26315789 0.2105263
7    0.70  3  3  2 11 0.6 0.31578947 0.2631579
8    0.65  3  4  2 10 0.6 0.36842105 0.3157895
9    0.60  4  4  1 10 0.8 0.42105263 0.2631579
10   0.55  4  5  1  9 0.8 0.47368421 0.3157895
11   0.50  5  5  0  9 1.0 0.52631579 0.2631579
12   0.45  5  6  0  8 1.0 0.57894737 0.3157895
13   0.40  5  7  0  7 1.0 0.63157895 0.3684211
14   0.35  5  8  0  6 1.0 0.68421053 0.4210526
15   0.30  5  9  0  5 1.0 0.73684211 0.4736842
16   0.25  5 10  0  4 1.0 0.78947368 0.5263158
17   0.20  5 11  0  3 1.0 0.84210526 0.5789474
18   0.15  5 12  0  2 1.0 0.89473684 0.6315789
19   0.10  5 13  0  1 1.0 0.94736842 0.6842105
20   0.05  5 14  0  0 1.0 1.00000000 0.7368421
PosPredRは下のように計算もできる。
(table_p1$TP+table_p1$FP) / (table_p1$TP+table_p1$FP+table_p1$FN+table_p1$TN)
リフトチャートをプロットしてみる。
plot(perf_p1)
# 45 degree line
abline(a=0, b=1, col="yellow")
# grid
abline( h=(0:10)/10, v=(1:10)/10, lty=3 )
各行でのTPR、PosPredRの点も重ねておく。
par(new=TRUE)
plot(table_p1$PosPredR, table_p1$TPR, xlab="", ylab="")

横軸が陽性予測率なので、例えば、予測値の高い順にならべ全データのうち20%を陽性と予測した場合(横軸が0.2 の位置)、予測正解率は60%(縦軸が0.6の位置)となりますよ、という解釈。
関数にまとめておく。
# リフトチャートを描く関数
fn_plot_CRC <- function(pred, obs, line45=TRUE, gridL=TRUE, color="black"){
pred1 <- prediction(predictions=pred, labels=obs)
perf1 <- performance(pred1, measure="tpr", x.measure="rpp")
plot(perf1, col=color)
# 45 degree line
if(line45==TRUE){ abline(a=0, b=1, col="yellow") }
# grid
if(gridL==TRUE){ abline( h=(0:10)/10, v=(1:10)/10, lty=3 ) }
}
pred1とpred2の重ね合わせてみる。
fn_plot_CRC(d_roc1$pred1, d_roc1$observed)
par(new=TRUE)
fn_plot_CRC(d_roc1$pred2, d_roc1$observed, color="blue")

モデル評価基準 - ROCに関して - R{ROCR}
モデル評価をROCを用いて行うと仮定した場合の、考察とメモ。
RのROCRパッケージを使用。
混同行列(Confusion Matrix)の復習。

こんなデータがあったとする。

pred1、pred2はそれぞれ、モデル1、モデル2による予測値。
observedは実測値。n=19で、Prob(observed=1)=5/19=0.263。
後で、比較を行いやすくするためモデル1、2は同水準の予測値を出力したと仮定してこのデータは作成している。
Rへデータの読み込み。
d_roc1 <- read.delim("clipboard", header=TRUE)
d_roc1
   pred1 pred2 observed
1   0.95  0.90        1
2   0.90  0.80        1
3   0.80  0.75        1
4   0.60  0.70        1
5   0.50  0.60        1
6   0.85  0.95        0
7   0.75  0.85        0
8   0.70  0.65        0
9   0.65  0.55        0
10  0.55  0.50        0
11  0.45  0.45        0
12  0.40  0.40        0
13  0.35  0.35        0
14  0.30  0.30        0
15  0.25  0.25        0
16  0.20  0.20        0
17  0.15  0.15        0
18  0.10  0.10        0
19  0.05  0.05        0
observation=1の割合。
base_ratio <- sum(d_roc1$observed==1)/length(d_roc1$observed)
0.2631579となる。
ROCRパッケージのロード。
library(ROCR)
pred1に関して、ROC分析を行う。
prediction(予測値,観測値)関数で、予測値(pred1)の大きい順に並び替え、TP,FP,FN,TNを計算。
pred_p1 <- prediction(predictions=d_roc1$pred1, labels=d_roc1$observed)
An object of class "prediction"
Slot "predictions":
1
 [1] 0.95 0.90 0.80 0.60 0.50 0.85 0.75 0.70 0.65 0.55 0.45 0.40 0.35 0.30 0.25 0.20
[17] 0.15 0.10 0.05


Slot "labels":
1
 [1] 1 1 1 1 1 0 0 0 0 0 0 0 0 0 0 0 0 0 0
Levels: 0 < 1


Slot "cutoffs":
1
 [1]  Inf 0.95 0.90 0.85 0.80 0.75 0.70 0.65 0.60 0.55 0.50 0.45 0.40 0.35 0.30 0.25
[17] 0.20 0.15 0.10 0.05


Slot "fp":
1
 [1]  0  0  0  1  1  2  3  4  4  5  5  6  7  8  9 10 11 12 13 14


Slot "tp":
1
 [1] 0 1 2 2 3 3 3 3 4 4 5 5 5 5 5 5 5 5 5 5


Slot "tn":
1
 [1] 14 14 14 13 13 12 11 10 10  9  9  8  7  6  5  4  3  2  1  0


Slot "fn":
1
 [1] 5 4 3 3 2 2 2 2 1 1 0 0 0 0 0 0 0 0 0 0


Slot "n.pos":
1
[1] 5


Slot "n.neg":
1
[1] 14


Slot "n.pos.pred":
1
 [1]  0  1  2  3  4  5  6  7  8  9 10 11 12 13 14 15 16 17 18 19


Slot "n.neg.pred":
1
 [1] 19 18 17 16 15 14 13 12 11 10  9  8  7  6  5  4  3  2  1  0
performance(predictionオブジェクト,測定基準1,測定基準2)で 感度(真陽性率)、1-特異度(偽陽性率)を計算。
perf_p1 <- performance(pred_p1, measure="tpr", x.measure="fpr")
# tpr: True Positive Rate, fpr: False Positive Rate
An object of class "performance"
Slot "x.name":
[1] "False positive rate"

Slot "y.name":
[1] "True positive rate"

Slot "alpha.name":
[1] "Cutoff"

Slot "x.values":
1
 [1] 0.00000000 0.00000000 0.00000000 0.07142857 0.07142857 0.14285714 0.21428571
 [8] 0.28571429 0.28571429 0.35714286 0.35714286 0.42857143 0.50000000 0.57142857
[15] 0.64285714 0.71428571 0.78571429 0.85714286 0.92857143 1.00000000


Slot "y.values":
1
 [1] 0.0 0.2 0.4 0.4 0.6 0.6 0.6 0.6 0.8 0.8 1.0 1.0 1.0 1.0 1.0 1.0 1.0 1.0 1.0 1.0


Slot "alpha.values":
1
 [1]  Inf 0.95 0.90 0.85 0.80 0.75 0.70 0.65 0.60 0.55 0.50 0.45 0.40 0.35 0.30 0.25
[17] 0.20 0.15 0.10 0.05
y.valuesがTPRで、x.valuesがFPRとなる。
ROC Tableの作成。MissClassRは後分類率。
ROCtable_p1 <- data.frame(Cutoff=unlist(pred_p1@cutoffs),
TP=unlist(pred_p1@tp), FP=unlist(pred_p1@fp),
FN=unlist(pred_p1@fn), TN=unlist(pred_p1@tn),
TPR=unlist(perf_p1@y.values), FPR=unlist(perf_p1@x.values),
diff_TPR_FPR=unlist(perf_p1@y.values)-unlist(perf_p1@x.values),
MissClasR=(unlist(pred_p1@fp)+unlist(pred_p1@fn))/(unlist(pred_p1@tp)+unlist(pred_p1@fp)+unlist(pred_p1@fn)+unlist(pred_p1@tn))
)
   Cutoff TP FP FN TN TPR        FPR diff_TPR_FPR MissClasR
1     Inf  0  0  5 14 0.0 0.00000000   0.00000000 0.2631579
2    0.95  1  0  4 14 0.2 0.00000000   0.20000000 0.2105263
3    0.90  2  0  3 14 0.4 0.00000000   0.40000000 0.1578947
4    0.85  2  1  3 13 0.4 0.07142857   0.32857143 0.2105263
5    0.80  3  1  2 13 0.6 0.07142857   0.52857143 0.1578947
6    0.75  3  2  2 12 0.6 0.14285714   0.45714286 0.2105263
7    0.70  3  3  2 11 0.6 0.21428571   0.38571429 0.2631579
8    0.65  3  4  2 10 0.6 0.28571429   0.31428571 0.3157895
9    0.60  4  4  1 10 0.8 0.28571429   0.51428571 0.2631579
10   0.55  4  5  1  9 0.8 0.35714286   0.44285714 0.3157895
11   0.50  5  5  0  9 1.0 0.35714286   0.64285714 0.2631579
12   0.45  5  6  0  8 1.0 0.42857143   0.57142857 0.3157895
13   0.40  5  7  0  7 1.0 0.50000000   0.50000000 0.3684211
14   0.35  5  8  0  6 1.0 0.57142857   0.42857143 0.4210526
15   0.30  5  9  0  5 1.0 0.64285714   0.35714286 0.4736842
16   0.25  5 10  0  4 1.0 0.71428571   0.28571429 0.5263158
17   0.20  5 11  0  3 1.0 0.78571429   0.21428571 0.5789474
18   0.15  5 12  0  2 1.0 0.85714286   0.14285714 0.6315789
19   0.10  5 13  0  1 1.0 0.92857143   0.07142857 0.6842105
20   0.05  5 14  0  0 1.0 1.00000000   0.00000000 0.7368421
例えば、TPRは以下でも計算可能。
ROCtable_p1$TP / (ROCtable_p1$TP+ROCtable_p1$FN)
[1] 0.0 0.2 0.4 0.4 0.6 0.6 0.6 0.6 0.8 0.8 1.0 1.0 1.0 1.0 1.0 1.0 1.0 1.0 1.0 1.0
TPR-FPRの最大値。
max(ROCtable_p1$diff_TPR_FPR)
0.6428571となる。
TPR-FPRの最大値とは、真陽性率を高めつつ偽陽性率を小さく押さえる最適な判断基準として、0/1の予測を分ける閾値(Cutt-off)として良く使われる。
この行を出力してみる。
for(i in 1:nrow(ROCtable_p1)){
mx <- max(ROCtable_p1$diff_TPR_FPR) # max value of TPR-FPR
if(ROCtable_p1$diff_TPR_FPR[i]==mx){ print(ROCtable_p1[i,]) }
}
   Cutoff TP FP FN TN TPR       FPR diff_TPR_FPR MissClasR
11    0.5  5  5  0  9   1 0.3571429    0.6428571 0.2631579
11行目が最大値となる。
上で、base_ratio=0.2631579と計算した。これは、すべて0と予測したときの誤分類率となる。
誤分類率がこの値より低い行を出力してみる。
for(i in 1:nrow(ROCtable_p1)){
if(ROCtable_p1$MissClasR[i]<=base_ratio){ print(ROCtable_p1[i,]) }
}
  Cutoff TP FP FN TN TPR FPR diff_TPR_FPR MissClasR
1    Inf  0  0  5 14   0   0            0 0.2631579
  Cutoff TP FP FN TN TPR FPR diff_TPR_FPR MissClasR
2   0.95  1  0  4 14 0.2   0          0.2 0.2105263
  Cutoff TP FP FN TN TPR FPR diff_TPR_FPR MissClasR
3    0.9  2  0  3 14 0.4   0          0.4 0.1578947
  Cutoff TP FP FN TN TPR        FPR diff_TPR_FPR MissClasR
4   0.85  2  1  3 13 0.4 0.07142857    0.3285714 0.2105263
  Cutoff TP FP FN TN TPR        FPR diff_TPR_FPR MissClasR
5    0.8  3  1  2 13 0.6 0.07142857    0.5285714 0.1578947
  Cutoff TP FP FN TN TPR       FPR diff_TPR_FPR MissClasR
6   0.75  3  2  2 12 0.6 0.1428571    0.4571429 0.2105263
  Cutoff TP FP FN TN TPR       FPR diff_TPR_FPR MissClasR
7    0.7  3  3  2 11 0.6 0.2142857    0.3857143 0.2631579
  Cutoff TP FP FN TN TPR       FPR diff_TPR_FPR MissClasR
9    0.6  4  4  1 10 0.8 0.2857143    0.5142857 0.2631579
   Cutoff TP FP FN TN TPR       FPR diff_TPR_FPR MissClasR
11    0.5  5  5  0  9   1 0.3571429    0.6428571 0.2631579
5行目が最小値。
min(ROCtable_p1$MissClasR)
0.1578947となる。
AUC(ROCの下の面積)の計算。モデルの精度を数値変換したもので、良く使われるモデル評価値の一つ。
auc.temp <- performance(pred_p1,"auc")
auc_p1 <- unlist(auc.temp@y.values)
0.8571429となる。
ROCをプロットする。
plot(perf_p1)
45度線も重ねる。
abline(a=0, b=1, col="yellow")
グリッド線も重ねる。
abline( h=(1:10)/10, v=(1:10)/10, lty=3 )
各行でのTPR、FPRの点も重ねておく。
par(new=TRUE)
plot(ROCtable_p1$FPR, ROCtable_p1$TPR, xlab="", ylab="")

TPRを縦軸に、FPRを横軸にプロットしたものがROCとなる。
要するに、縦軸が「実際に1のものを1と予測できた割合」、横軸が「実際は0のものを1と予測してしまった割合」。
ある予測モデルのROCとは、その予測モデルによる予測値をさまざまな箇所で切った場合、どの程度0/1を正確に判断できるかを把握するためのグラフとなる。
上のROC TableのTPRとFPRを上から順にプロットして、点を繋いだたもの。
各点において、混同行列を作成できる。
誤分類率が最小になる5行目と、TPR-FPRが最大となる11行目の混同行列をROCプロットにメモしておくとこんな感じ。

閾値をどこにするか、すなわち、どこで切って0/1を判断するかは、分析の目的による。
pred2に関してもROC分析を行い、この点に関して考えてみる。
上の各手続きを関数化しておく。
# ROCテーブルを返す関数
fn_ROC_Table <- function(pred, obs){
pred1 <- prediction(predictions=pred, labels=obs)
perf1 <- performance(pred1, measure="tpr", x.measure="fpr")
# ROC Tableの作成
# MissClassRは後分類率
ROCtable <- data.frame(
Cutoff=unlist(pred1@cutoffs),
TP=unlist(pred1@tp), FP=unlist(pred1@fp),
FN=unlist(pred1@fn), TN=unlist(pred1@tn),
TPR=unlist(perf1@y.values), FPR=unlist(perf1@x.values),
diff_TPR_FPR=unlist(perf1@y.values)-unlist(perf1@x.values),
MissClasR=(unlist(pred1@fp)+unlist(pred1@fn))/
(unlist(pred1@tp)+unlist(pred1@fp)+unlist(pred1@fn)+unlist(pred1@tn))
)
return(ROCtable)
}
fn_ROC_Table(d_roc1$pred1, d_roc1$observed)でROCtable_p1と同じとなる。
pred2に関して。
fn_ROC_Table(d_roc1$pred2, d_roc1$observed)
   Cutoff TP FP FN TN TPR        FPR diff_TPR_FPR MissClasR
1     Inf  0  0  5 14 0.0 0.00000000   0.00000000 0.2631579
2    0.95  0  1  5 13 0.0 0.07142857  -0.07142857 0.3157895
3    0.90  1  1  4 13 0.2 0.07142857   0.12857143 0.2631579
4    0.85  1  2  4 12 0.2 0.14285714   0.05714286 0.3157895
5    0.80  2  2  3 12 0.4 0.14285714   0.25714286 0.2631579
6    0.75  3  2  2 12 0.6 0.14285714   0.45714286 0.2105263
7    0.70  4  2  1 12 0.8 0.14285714   0.65714286 0.1578947
8    0.65  4  3  1 11 0.8 0.21428571   0.58571429 0.2105263
9    0.60  5  3  0 11 1.0 0.21428571   0.78571429 0.1578947
10   0.55  5  4  0 10 1.0 0.28571429   0.71428571 0.2105263
11   0.50  5  5  0  9 1.0 0.35714286   0.64285714 0.2631579
12   0.45  5  6  0  8 1.0 0.42857143   0.57142857 0.3157895
13   0.40  5  7  0  7 1.0 0.50000000   0.50000000 0.3684211
14   0.35  5  8  0  6 1.0 0.57142857   0.42857143 0.4210526
15   0.30  5  9  0  5 1.0 0.64285714   0.35714286 0.4736842
16   0.25  5 10  0  4 1.0 0.71428571   0.28571429 0.5263158
17   0.20  5 11  0  3 1.0 0.78571429   0.21428571 0.5789474
18   0.15  5 12  0  2 1.0 0.85714286   0.14285714 0.6315789
19   0.10  5 13  0  1 1.0 0.92857143   0.07142857 0.6842105
20   0.05  5 14  0  0 1.0 1.00000000   0.00000000 0.7368421
# AUCを返す関数
fn_AUC <- function(pred, obs){
pred1 <- prediction(predictions=pred, labels=obs)
auc.temp <- performance(pred1, "auc")
auc <- unlist(auc.temp@y.values)
return(auc)
}
fn_AUC(d_roc1$pred1, d_roc1$observed)でauc_p1と同じとなる。
pred2に関して。
fn_AUC(d_roc1$pred2, d_roc1$observed)
0.8571429と、AUCはpred1と同じである。
# ROC曲線を描く関数
fn_plot_ROC <- function(pred, obs, line45=TRUE, gridL=TRUE, color="black"){
pred1 <- prediction(predictions=pred, labels=obs)
perf1 <- performance(pred1, measure="tpr", x.measure="fpr")
plot(perf1, col=color)
# 45 degree line
if(line45==TRUE){ abline(a=0, b=1, col="yellow") }
# grid
if(gridL==TRUE){ abline( h=(1:10)/10, v=(1:10)/10, lty=3 ) }
}
fn_plot_ROC(d_roc1$pred1, d_roc1$observed)でplot(perf_p1)と同じになる。
pred1とpred2の曲線を重ねてみる。
fn_plot_ROC(d_roc1$pred1, d_roc1$observed)
par(new=TRUE)
fn_plot_ROC(d_roc1$pred2, d_roc1$observed, color="blue")

黒がpred1で、青がpred2である。
AUCの値は両方とも同じであるが、曲線の形状は異なる。
pred1はROCの下側が外に膨らんでおり、pred2はROCの上側が外に膨らんでいる。
このデータを別の書き方をしてみる。
データは、pred1と2の予測値の水準を同じとした擬似的なものなので、この予測値の大きい順に並び替えてみる。

predがpred1と2の値。obs of pred1がpred1の予測値に対応したobserved。obs of pred2がpred2に対応したobservedである。
少数のみ1と予測したくて、その1と予測したオブザベーションが実際に1である場合を多くしたい場合は、pred1型のROCとなるモデルを採用するのが良い。
沢山1と予測してしまってはまずい場合。
なるべく1である場合をもらざず、がさっと取ってきたいときはは、pred2型のROCとなるモデルを採用するのが良い。
1を逃してしまうとまずい場合。
では、AUCがどの程度の精度を持つか、予測値をランダム出力し、シミュレーションしてみる。一様分布により、0から1の間の予測値を出力する。
observation(1/0)の指定。この割合をいろいろと変えてシミュレーションしてみる。
obs1 <- c(rep(1,10), rep(0,15))
[1] 1 1 1 1 1 1 1 1 1 1 0 0 0 0 0 0 0 0 0 0 0 0 0 0 0
length1 <- length(obs1)
# AUCを格納するベクトル
auc1 <- c()
# シミュレーション回数(100回)
n_sim <- 100
for(i in 1:n_sim){
pred1 <- runif(length1) # 一様分布
# plot ROC
fn_plot_ROC(pred1, obs1)
if(i>=n_sim){ break }
par(new=TRUE)
# AUC
auc1 <- append(auc1, fn_AUC(pred1, obs1))
i <- i+1
}

シミュレーションにより計算したAUC(100個)のQuantileを求める。
quantile(auc1)
       0%       25%       50%       75%      100%
0.1933333 0.4633333 0.5266667 0.5900000 0.7866667
データ数が25くらいだと、全く意味のないモデルでもAUCがかなり高くなることがある。
数を増やしてみる。合計10,000行のデータ。
obs1 <- c(rep(1,1000), rep(0,9000))
として、上のシミュレーションコードを実行。

       0%       25%       50%       75%      100%
0.4732207 0.4911747 0.4994109 0.5058587 0.5229493
これくらいデータがあると、ランダム予測AUCは0.5という理論が成り立つ。
ちょっと1/0のバランスが悪い場合。
obs1 <- c(rep(1,5), rep(0,200))
5/205=0.024。

    0%    25%    50%    75%   100%
0.1930 0.4345 0.5270 0.6275 0.8130
1が5個しかないので、縦軸のTPRは5段分割しかされない。
データは合計で205あるが、AUCも大きくばらつく。1/0を100づつでシミュレーションすると、こんなに大きくAUCがばらつくことはない。
GLMMを勉強してみる。 - R glmmML
GLMM(リンク関数=ロジスティック関数、分布=二項分布)を勉強してみる。RのglmmML使用。
久保(2012) の7章を参考。

データ解析のための統計モデリング入門――一般化線形モデル・階層ベイズモデル・MCMC (確率と情報の科学)
- 作者: 久保拓弥
- 出版社/メーカー: 岩波書店
- 発売日: 2012/05/19
- メディア: 単行本
- 購入: 16人 クリック: 163回
- この商品を含むブログ (21件) を見る
ロジスティック回帰モデルの復習。

これにランダム効果を加えると。

文献で取り上げている種子の例でなく、自分の事例に合ったサンプルデータを作成してみる。
「インサイドセールス20人が顧客からインバウンドコールを受ける。セールスを行い、契約につながったかどうかを記録する。取得できる顧客情報は性別の年齢区分。顧客情報と契約率との関係を分析する。インサイドセールスによって、パフォーマンスは異なる。(インサイドセールスによる影響をランダム効果とする。)」
1200行のデータ。1200件のインバウンドコールのデータとなる。
n_row <- 1200
行番号。
Row_ID <- 1:n_row
インサイドセールスの作成。
n1 <- n_row * 0.7
n2 <- n_row * 0.3
salesID <- sort( c( rpois(n=n1, lambda=7)+1, sample(1:20, n2, replace=TRUE)) )
salesID_count <- table( salesID )
salesID
  1   2   3   4   5   6   7   8   9  10  11  12  13  14  15  16  17  18  19  20
 14  28  26  86  88 133 144 149 116 111  63  48  39  36  18  18  20  24  14  25
各20人のインサイドセールスが受けたインバウンドコールの数。
インサイドセールスの違いより発生するランダム効果。
s <- 2 ## rand effect真のパラメータ
randEff <- rnorm(n=20, mean=0, sd=s)
mean(randEff)
[1] -0.007712367
sd(randEff) ## rand effect実際のパラメータ
[1] 2.163217
各インサイドセールスによるランダム効果の列の作成。
randEff_col <- c(NULL)
for(i in 1:length(randEff)){
randEff_col <- append( randEff_col, rep(randEff[i], salesID_count[i]) )
}
顧客の性別の作成。男女比、M:F = 3:7、となるように作成。
rand_num_sex <- runif(n=n_row, min = 0, max = 1)
fn_sex <- function(i){
if(i<0.3){return("M")}
else{return("F")}
}
sex_col <- sapply(rand_num_sex, fn_sex)
顧客の年代の作成。年代比、40以下:60以下:60以上 = 15:30:55で作成。
rand_num_age <- runif(n=n_row, min = 0, max = 1)
fn_age <- function(i){
if(i<0.15){return("-40")}
else if(i<0.45){return("-60")}
else{return("60-")}
}
age_col <- sapply(rand_num_age, fn_age)
二項分布のパラメータ(q)の作成。
真のパラメータ定義を行う。
切片
beta0 <- -4 # intercept
性別Mに対するFの効果
beta1 <- 2 # sex="F"
年代40以下に対する、60以下の効果
beta2_1 <- 0.5 # age="-60"
年代40以下に対する、60以上の効果
beta2_2 <- 1.5 # age="60-"
性別、年代、インサイドセールスの効果を入れて、ロジスティック関数によりqを出力する。
fn_q <- function(id){
if(sex_col[id]=="F"){effect_sex <- beta1}
else{effect_sex <- 0}
if(age_col[id]=="-60"){effect_age <- beta2_1}
else if(age_col[id]=="60-"){effect_age <- beta2_2}
else{effect_age <- 0}
lin <- beta0 + effect_sex + effect_age + randEff_col[id]
return( 1 / (1+exp(-lin)) )
}
q_col <- sapply(Row_ID, fn_q)
このqを二項分布のパラメータとし、確率変数yを出力。
fn_y <- function(q){
return( rbinom(n=1, size=1, prob=q) )
}
y_col <- sapply(q_col, fn_y)
Train, Testデータを1000:200で分ける。
td1 <- n_row * 1000/1200
td2 <- n_row * 200/1200
test_col0 <- c( rep("Train", td1), rep("Test", td2) )
# ランダム化
test_col <- sample(test_col0, n_row, replace=FALSE)
データフレームにまとめる。
data0 <- data.frame(Row_ID, Sales_ID=salesID, SalesRandEffect=randEff_col, Sex=sex_col, Age=age_col, q=q_col, y=y_col, Test=test_col)
# モデルをあてはめた際の係数の解釈上、カテゴリ変数Sexの順序を入れ替えておく
data0$Sex <- factor(data0$Sex, levels=c("M","F"))
data0
     Row_ID Sales_ID SalesRandEffect Sex Age            q y  Test
1         1        1      -2.3580976   M 60- 0.0077054077 0 Train
2         2        1      -2.3580976   F -60 0.0206717743 0 Train
3         3        1      -2.3580976   M -40 0.0017296628 0 Train
4         4        1      -2.3580976   F 60- 0.0542642460 0 Train
5         5        1      -2.3580976   F 60- 0.0542642460 0 Train
6         6        1      -2.3580976   F 60- 0.0542642460 0 Train
7         7        1      -2.3580976   M 60- 0.0077054077 0 Train
8         8        1      -2.3580976   F 60- 0.0542642460 0 Train
9         9        1      -2.3580976   M 60- 0.0077054077 0 Train
10       10        1      -2.3580976   F 60- 0.0542642460 0 Train
11       11        1      -2.3580976   M 60- 0.0077054077 0 Train
12       12        1      -2.3580976   F 60- 0.0542642460 1 Train
.............................. skip
1191   1191       20       1.2576302   F 60- 0.6808390084 0  Test
1192   1192       20       1.2576302   F 60- 0.6808390084 1 Train
1193   1193       20       1.2576302   F 60- 0.6808390084 1 Train
1194   1194       20       1.2576302   F 60- 0.6808390084 0  Test
1195   1195       20       1.2576302   F 60- 0.6808390084 1 Train
1196   1196       20       1.2576302   F 60- 0.6808390084 0 Train
1197   1197       20       1.2576302   M -40 0.0605190257 0 Train
1198   1198       20       1.2576302   M 60- 0.2240237610 0 Train
1199   1199       20       1.2576302   F -60 0.4397024392 1 Train
1200   1200       20       1.2576302   F -60 0.4397024392 1  Test
SalesRandEffectはランダム効果なので、もちろん観測されない。
qは真の二項分布のパラメータ(Sex, Age, SalesRandEffectに依存)となるが、これももちろん観測はされない。
TrainデータとTestデータを分ける。
data1 <- data0[data0$Test=="Train",]
data1_test <- data0[data0$Test=="Test",]
分布の確認。
summary(data1)
     Row_ID          Sales_ID     SalesRandEffect   Sex      Age            q
 Min.   :   1.0   Min.   : 1.00   Min.   :-3.1455   M:301   -40:164   Min.   :0.0007878
 1st Qu.: 299.8   1st Qu.: 6.00   1st Qu.:-1.6508   F:699   -60:306   1st Qu.:0.0380138
 Median : 604.5   Median : 8.00   Median :-0.6385           60-:530   Median :0.1209089
 Mean   : 603.0   Mean   : 8.75   Mean   : 0.5669                     Mean   :0.3367441
 3rd Qu.: 904.2   3rd Qu.:11.00   3rd Qu.: 1.6061                     3rd Qu.:0.6569576
 Max.   :1199.0   Max.   :20.00   Max.   : 5.7100                     Max.   :0.9945678
       y            Test
 Min.   :0.000   Test :   0
 1st Qu.:0.000   Train:1000
 Median :0.000
 Mean   :0.341
 3rd Qu.:1.000
 Max.   :1.000
summary(data1_test)
     Row_ID          Sales_ID     SalesRandEffect   Sex      Age            q
 Min.   :  14.0   Min.   : 1.00   Min.   :-3.1455   M: 61   -40: 25   Min.   :0.003233
 1st Qu.: 316.8   1st Qu.: 6.00   1st Qu.:-1.6508   F:139   -60: 58   1st Qu.:0.041059
 Median : 580.0   Median : 8.00   Median :-0.6385           60-:117   Median :0.177129
 Mean   : 588.2   Mean   : 8.55   Mean   : 0.7733                     Mean   :0.365478
 3rd Qu.: 889.5   3rd Qu.:10.00   3rd Qu.: 4.5274                     3rd Qu.:0.740155
 Max.   :1200.0   Max.   :20.00   Max.   : 5.7100                     Max.   :0.994568
       y            Test
 Min.   :0.000   Test :200
 1st Qu.:0.000   Train:  0
 Median :0.000
 Mean   :0.355
 3rd Qu.:1.000
 Max.   :1.000
JMPでグラフを描く。

上段がTestデータで、下段がTrainデータ。
y=1、つまり契約、を強調表示してある。
table(data1$y)
  0   1
659 341
table(data1_test$y)
  0   1
129  71
各データセットで、1(契約)の割合の確認。
# % of 1 (data1)
table(data1$y)[2]/sum(table(data1$y))
0.341
# % of 1 (data1_test)
table(data1_test$y)[2]/sum(table(data1_test$y))
0.355
まずはランダム効果を考慮せず、通常のロジスティック回帰(GLM)を試してみる。
説明変数はSexとAge。
res_glm1 <- glm(y~Sex+Age, data=data1, family=binomial)
Call:  glm(formula = y ~ Sex + Age, family = binomial, data = data1)

Coefficients:
(Intercept)         SexF       Age-60       Age60-
   -1.31114      0.60076      0.06984      0.36629

Degrees of Freedom: 999 Total (i.e. Null);  996 Residual
Null Deviance:      1283
Residual Deviance: 1262         AIC: 1270
真のパラメータはInterceptが-4、Sex Fが2、Age -60が0.5、Age 60-が1.5と設定してあるので、+/-の方角は合っているが、値はずれている感じがする。
Trainデータへ作成したモデルをあてはめ、qを出力。
pred_glm0 <- predict(res_glm1)
pred_glm <- 1 / (1 + exp(-1*pred_glm0))
Testデータへ作成したモデルをあてはめ、qを出力。
pred_glm_test0 <- predict(res_glm1, newdata=data1_test)
pred_glm_test <- 1 / (1 + exp(-1*pred_glm_test0))
ロジスティック回帰(ランダム効果あり)のあてはめ。(GLMM)
説明変数はSexとAge、ランダム効果にSales_IDを指定。
library(glmmML)
res_glmm1 <- glmmML(y~Sex+Age, data=data1, family=binomial, cluster=Sales_ID)
Call:  glmmML(formula = y ~ Sex + Age, family = binomial, data = data1,      cluster = Sales_ID)


               coef se(coef)       z Pr(>|z|)
(Intercept) -3.1060   0.5724 -5.4267 5.74e-08
SexF         1.4090   0.2760  5.1057 3.30e-07
Age-60       0.1904   0.3411  0.5583 5.77e-01
Age60-       1.0691   0.3137  3.4079 6.55e-04

Scale parameter in mixing distribution:  1.939 gaussian
Std. Error:                              0.276

        LR p-value for H_0: sigma = 0:  8.066e-131

Residual deviance: 671.3 on 995 degrees of freedom      AIC: 681.3
真のパラメータはInterceptが-4、Sex Fが2、Age -60が0.5、Age 60-が1.5と設定してあるの。まあ、上のGLMよりかは近い気がする。また、sは1.939と推定されており、実際の2.163217(2と設定して、ランダムに20サンプルの正規確率変数を生成し、その標準偏差が2.163217)に近い。
predict関数はglmmMLに未対応のよう。
predict(res_glmm1)
Error in UseMethod("predict") :
  no applicable method for 'predict' applied to an object of class "glmmML"
仕方がないので、自作予測関数を定義する。今回は変量効果の予測値を、予測に含めない。(各インサイドセールスの違いの効果を予測に含めない。)
推定パラメータを渡す。
para_intercept <- res_glmm1$coefficients[1]
para_Sex_F <- res_glmm1$coefficients[2]
para_Age_under60 <- res_glmm1$coefficients[3]
para_Age_over60 <- res_glmm1$coefficients[4]
説明変数のデータフレーム(Sex, Age)を引数に取り、予測qを返す関数。
fn_predict <- function(vec){
s <- vec[1]
a <- vec[2]
if(s=="F"){eff_sex <- para_Sex_F}
else if(s=="M"){eff_sex <- 0}
else{stop("Sex should be F or M")}
if(a=="-40"){eff_age <- 0}
else if(a=="-60"){eff_age <- para_Age_under60}
else if(a=="60-"){eff_age <- para_Age_over60}
else{stop("Age should be -40, -60, or 60-")}
lin_fn <- para_intercept + eff_sex + eff_age
return( 1 / (1+exp(-lin_fn)) )
}
Trainデータへ作成したモデルをあてはめ、qを出力。
pred_glmm <- apply(data1[4:5], 1, fn_predict)
Testデータへ作成したモデルをあてはめ、qを出力。
pred_glmm_test <- apply(data1_test[4:5], 1, fn_predict)
データフレームにまとめる。
data2 <- rbind( cbind(data1, pred_glm, pred_glmm), cbind(data1_test, pred_glm=pred_glm_test, pred_glmm=pred_glmm_test) )
     Row_ID Sales_ID SalesRandEffect Sex Age            q y  Test
1         1        1      -2.3580976   M 60- 0.0077054077 0 Train
2         2        1      -2.3580976   F -60 0.0206717743 0 Train
3         3        1      -2.3580976   M -40 0.0017296628 0 Train
4         4        1      -2.3580976   F 60- 0.0542642460 0 Train
5         5        1      -2.3580976   F 60- 0.0542642460 0 Train
6         6        1      -2.3580976   F 60- 0.0542642460 0 Train
7         7        1      -2.3580976   M 60- 0.0077054077 0 Train
8         8        1      -2.3580976   F 60- 0.0542642460 0 Train
9         9        1      -2.3580976   M 60- 0.0077054077 0 Train
10       10        1      -2.3580976   F 60- 0.0542642460 0 Train
...................................
      pred_glm  pred_glmm
1    0.2799215 0.11538247
2    0.3451238 0.18144787
3    0.2122954 0.04285945
4    0.4148172 0.34798986
5    0.4148172 0.34798986
6    0.4148172 0.34798986
7    0.2799215 0.11538247
8    0.4148172 0.34798986
9    0.2799215 0.11538247
10   0.4148172 0.34798986
....................................
結果を集計してみる。

GLMの方が、気持ちパフォーマンスが良いように見える。ただし、上記したように、変量効果(インサイドセールス)の予測値をこの予測結果に含めてはいない。
glmmMLはprediction関数をサポートしてない。もともと医療系の統計っぽいことをやってきてた私自身、GLMMを予測に使うイメージがあまりなかった。
RでGLMMを実行する場合、glmmMLでなくlme4パッケージの方が標準だと聞いたこともある。
lme4のモデル関数(lmer, glmer)はpredict関数をサポートしているようである。
lme4: Mixed-effects modeling with R
今後、lme4の使用メモを残す予定。
以上。
多項ロジット(Multinomial Logit), R - mlogit 使用メモ
Rのmlogitパッケージで多項ロジット(Multinomial Logit)を使用する際のメモ。
まず、用語の整理。参考文献(A) p.8より。
-------------------------
A model with only individual specific variables is sometimes called a multinomial logit (多項ロジット)model, one with only alternative specific variables a conditional logit(条件付ロジット) model and one with both kind of variables a mixed logit(混合ロジット) model.
This is seriously misleading: conditional logit model is also a logit model for longitudinal data in the statistical literature and mixed logit is one of the names of a logit model with random parameters. Therefore, in what follow, we'll use the name multinomial logit model for the model we've just described whatever the nature of the explanatory variables included in the model.
-------------------------
とのことなので、多項ロジット(Multinomial Logit)と呼ぶことにする。
指定する説明変数がややこしいので、整理しておく。
以下のように効用関数が定義されるとする。

i : 個人の添え字
j : 選択肢の添え字
αj は、選択肢jの基本的効用と考えられる。
β : 個人iと選択肢jによって異なる変数Xijに対して、共通の係数
γj : 個人iに固有の変数Ziに対して、選択肢j別に異なる係数
σj : 個人iと選択肢jによって異なる変数Wijに対して、選択肢j別に異なる係数
library(mlogit)
data(Fishing)
head(Fishing, 10)
      mode price.beach price.pier price.boat price.charter catch.beach
1  charter     157.930    157.930    157.930       182.930      0.0678
2  charter      15.114     15.114     10.534        34.534      0.1049
3     boat     161.874    161.874     24.334        59.334      0.5333
4     pier      15.134     15.134     55.930        84.930      0.0678
5     boat     106.930    106.930     41.514        71.014      0.0678
6  charter     192.474    192.474     28.934        63.934      0.5333
7    beach      51.934     51.934    191.930       220.930      0.0678
8  charter      15.134     15.134     21.714        56.714      0.0678
9     boat      34.914     34.914     34.914        53.414      0.2537
10    boat      28.314     28.314     28.314        46.814      0.2537
   catch.pier catch.boat catch.charter   income
1      0.0503     0.2601        0.5391 7083.332
2      0.0451     0.1574        0.4671 1250.000
3      0.4522     0.2413        1.0266 3750.000
4      0.0789     0.1643        0.5391 2083.333
5      0.0503     0.1082        0.3240 4583.332
6      0.4522     0.1665        0.3975 4583.332
7      0.0789     0.1643        0.5391 8750.001
8      0.0789     0.0102        0.0209 2083.333
9      0.1498     0.0233        0.0219 3750.000
10     0.1498     0.0233        0.0219 2916.667
一列が1個人となっている”wide型”と呼ばれるデータ。
str(Fishing)
'data.frame':   1182 obs. of  10 variables:
 $ mode         : Factor w/ 4 levels "beach","pier",..: 4 4 3 2 3 4 1 4 3 3 ...
 $ price.beach  : num  157.9 15.1 161.9 15.1 106.9 ...
 $ price.pier   : num  157.9 15.1 161.9 15.1 106.9 ...
 $ price.boat   : num  157.9 10.5 24.3 55.9 41.5 ...
 $ price.charter: num  182.9 34.5 59.3 84.9 71 ...
 $ catch.beach  : num  0.0678 0.1049 0.5333 0.0678 0.0678 ...
 $ catch.pier   : num  0.0503 0.0451 0.4522 0.0789 0.0503 ...
 $ catch.boat   : num  0.26 0.157 0.241 0.164 0.108 ...
 $ catch.charter: num  0.539 0.467 1.027 0.539 0.324 ...
 $ income       : num  7083 1250 3750 2083 4583 ...
Mlogitによってモデルをあてはめるには、mlogit.data型に変換する必要がある。
Fish <- mlogit.data(Fishing, varying = c(2:9), shape = "wide", choice ="mode")
Fishingはサンプルデータで、実データで実施すると上手く行かないことが多いが、とりあえず続ける。
ここら辺の変換はhelpを参考にすればよい。
head(Fish, 12)
           mode   income     alt   price  catch chid
1.beach   FALSE 7083.332   beach 157.930 0.0678    1
1.boat    FALSE 7083.332    boat 157.930 0.2601    1
1.charter  TRUE 7083.332 charter 182.930 0.5391    1
1.pier    FALSE 7083.332    pier 157.930 0.0503    1
2.beach   FALSE 1250.000   beach  15.114 0.1049    2
2.boat    FALSE 1250.000    boat  10.534 0.1574    2
2.charter  TRUE 1250.000 charter  34.534 0.4671    2
2.pier    FALSE 1250.000    pier  15.114 0.0451    2
3.beach   FALSE 3750.000   beach 161.874 0.5333    3
3.boat     TRUE 3750.000    boat  24.334 0.2413    3
3.charter FALSE 3750.000 charter  59.334 1.0266    3
3.pier    FALSE 3750.000    pier 161.874 0.4522    3
4行(選択肢の総数)で1個人のデータとなる。
str(Fish)
Classes ‘mlogit.data’ and 'data.frame':       4728 obs. of  6 variables:
 $ mode  : logi  FALSE FALSE TRUE FALSE FALSE FALSE ...
 $ income: num  7083 7083 7083 7083 1250 ...
 $ alt   : chr  "beach" "boat" "charter" "pier" ...
 $ price : num  157.9 157.9 182.9 157.9 15.1 ...
 $ catch : num  0.0678 0.2601 0.5391 0.0503 0.1049 ...
 $ chid  : int  1 1 1 1 2 2 2 2 3 3 ...
 - attr(*, "reshapeLong")=List of 4
  ..$ varying:List of 2
  .. ..$ price: chr  "price.beach" "price.pier" "price.boat" "price.charter"
  .. ..$ catch: chr  "catch.beach" "catch.pier" "catch.boat" "catch.charter"
  .. ..- attr(*, "v.names")= chr  "price" "catch"
  .. ..- attr(*, "times")= chr  "beach" "pier" "boat" "charter"
  ..$ v.names: chr  "price" "catch"
  ..$ idvar  : chr "chid"
  ..$ timevar: chr "alt"
 - attr(*, "index")='data.frame':       4728 obs. of  2 variables:
  ..$ chid: Factor w/ 1182 levels "1","2","3","4",..: 1 1 1 1 2 2 2 2 3 3 ...
  ..$ alt : Factor w/ 4 levels "beach","boat",..: 1 2 3 4 1 2 3 4 1 2 ...
 - attr(*, "choice")= chr "mode"
目的変数となるmodeはlogical型になる。
もう一つ、サンプルデータ。
library(AER)
data(TravelMode)
str(TravelMode)
'data.frame':   840 obs. of  9 variables:
 $ individual: Factor w/ 210 levels "1","2","3","4",..: 1 1 1 1 2 2 2 2 3 3 ...
 $ mode      : Factor w/ 4 levels "air","train",..: 1 2 3 4 1 2 3 4 1 2 ...
 $ choice    : Factor w/ 2 levels "no","yes": 1 1 1 2 1 1 1 2 1 1 ...
 $ wait      : int  69 34 35 0 64 44 53 0 69 34 ...
 $ vcost     : int  59 31 25 10 58 31 25 11 115 98 ...
 $ travel    : int  100 372 417 180 68 354 399 255 125 892 ...
 $ gcost     : int  70 71 70 30 68 84 85 50 129 195 ...
 $ income    : int  35 35 35 35 30 30 30 30 40 40 ...
 $ size      : int  1 1 1 1 2 2 2 2 1 1 ...
head(TravelMode, 10)
   individual  mode choice wait vcost travel gcost income size
1           1   air     no   69    59    100    70     35    1
2           1 train     no   34    31    372    71     35    1
3           1   bus     no   35    25    417    70     35    1
4           1   car    yes    0    10    180    30     35    1
5           2   air     no   64    58     68    68     30    2
6           2 train     no   44    31    354    84     30    2
7           2   bus     no   53    25    399    85     30    2
8           2   car    yes    0    11    255    50     30    2
9           3   air     no   69   115    125   129     40    1
10          3 train     no   34    98    892   195     40    1
“long型”と呼ばれるデータ。
mlogit.data型に変換。
TM <- mlogit.data(TravelMode, choice = "choice", shape = "long", id.var = "individual", alt.levels = c("air", "train", "bus", "car"))
str(TM)
Classes ‘mlogit.data’ and 'data.frame':       840 obs. of  9 variables:
 $ individual: Factor w/ 210 levels "1","2","3","4",..: 1 1 1 1 2 2 2 2 3 3 ...
 $ mode      : Factor w/ 4 levels "air","train",..: 1 2 3 4 1 2 3 4 1 2 ...
 $ choice    : logi  FALSE FALSE FALSE TRUE FALSE FALSE ...
 $ wait      : int  69 34 35 0 64 44 53 0 69 34 ...
 $ vcost     : int  59 31 25 10 58 31 25 11 115 98 ...
 $ travel    : int  100 372 417 180 68 354 399 255 125 892 ...
 $ gcost     : int  70 71 70 30 68 84 85 50 129 195 ...
 $ income    : int  35 35 35 35 30 30 30 30 40 40 ...
 $ size      : int  1 1 1 1 2 2 2 2 1 1 ...
 - attr(*, "index")='data.frame':       840 obs. of  3 variables:
  ..$ chid: Factor w/ 210 levels "1","2","3","4",..: 1 1 1 1 2 2 2 2 3 3 ...
  ..$ alt : Factor w/ 4 levels "air","train",..: 1 2 3 4 1 2 3 4 1 2 ...
  ..$ id  : Factor w/ 210 levels "1","2","3","4",..: 1 1 1 1 2 2 2 2 3 3 ...
 - attr(*, "choice")= chr "choice"
head(TM, 12)
        individual  mode choice wait vcost travel gcost income size
1.air            1   air  FALSE   69    59    100    70     35    1
1.train          1 train  FALSE   34    31    372    71     35    1
1.bus            1   bus  FALSE   35    25    417    70     35    1
1.car            1   car   TRUE    0    10    180    30     35    1
2.air            2   air  FALSE   64    58     68    68     30    2
2.train          2 train  FALSE   44    31    354    84     30    2
2.bus            2   bus  FALSE   53    25    399    85     30    2
2.car            2   car   TRUE    0    11    255    50     30    2
3.air            3   air  FALSE   69   115    125   129     40    1
3.train          3 train  FALSE   34    98    892   195     40    1
3.bus            3   bus  FALSE   35    53    882   149     40    1
3.car            3   car   TRUE    0    23    720   101     40    1
4行(選択肢の総数)で1個人。
Helpにデータ項目の簡単な説明がある。
210人のデータである。
選択に関するクロス集計。
( actChoice <- table(TM$mode, TM$choice) )
        FALSE TRUE
  air     152   58
  train   147   63
  bus     180   30
  car     151   59
割合で出す場合。
( actChoiceRatio <- actChoice[,2]/210 ) # 210 = #individuals
      air     train       bus       car
0.2761905 0.3000000 0.1428571 0.2809524
では、多項ロジットモデルのあてはめを行う。
FitTM <- mlogit(choice ~ vcost | income | travel, data=TM)
formulaは、“|”が仕切りとなって分かれている。
これは、上で説明したように、Xij | Zi | Wij とそれぞれの変数の役割に従って指定する。
vcostは各個人iが提示された各選択肢jの値段(各乗り物の値段)である。個人iによって同じ選択肢jでも値段が異なっていることに注意。もしi間で共通の変数であれば、選択肢と全く同じとなってしまうので、モデルに含めることはできない。
vcost変数の、選択肢jによって異ならない共通の効用への影響度を推定する(β)。
incomeは収入で、選択肢jに依存しない、個人i依存の変数である。
incom変数の、効用への影響度を選択肢j別に推定する(γj)。
travelは各個人iが選択肢jを選択した場合に経験するトラベルタイムである。
travel変数の、効用への影響度を選択肢j別に推定する(σj)。トラベルタイムに対して感じる効用が、選択肢(乗り物)によって異なると仮定する場合はここに変数を入れるのだと思われる。
結果の確認。
summary( FitTM )
Call:
mlogit(formula = choice ~ vcost | income | travel, data = TM,
    method = "nr", print.level = 0)

Frequencies of alternatives:
    air   train     bus     car
0.27619 0.30000 0.14286 0.28095

nr method
5 iterations, 0h:0m:0s
g'(-H)^-1g = 7.87E-05
successive function values within tolerance limits

Coefficients :
                    Estimate Std. Error t-value  Pr(>|t|)
train:(intercept)  1.6866632  0.8477430  1.9896  0.046636 *
bus:(intercept)    0.1449168  0.9201414  0.1575  0.874856
car:(intercept)   -0.7699463  0.8161644 -0.9434  0.345491
vcost             -0.0056710  0.0066967 -0.8468  0.397089
train:income      -0.0598253  0.0129413 -4.6228 3.786e-06 ***
bus:income        -0.0414433  0.0136923 -3.0268  0.002472 **
car:income        -0.0129009  0.0111799 -1.1539  0.248527
air:travel        -0.0367774  0.0067680 -5.4340 5.509e-08 ***
train:travel      -0.0074593  0.0011859 -6.2898 3.180e-10 ***
bus:travel        -0.0068219  0.0013397 -5.0922 3.539e-07 ***
car:travel        -0.0066324  0.0011331 -5.8531 4.825e-09 ***
---
Signif. codes:  0 ‘***’ 0.001 ‘**’ 0.01 ‘*’ 0.05 ‘.’ 0.1 ‘ ’ 1

Log-Likelihood: -232.48
McFadden R^2:  0.18071
Likelihood ratio test : chisq = 102.56 (p.value = < 2.22e-16)
ここで出てくる“Frequencies of alternatives:”は上で計算したとおり、実測選択の割合である。予測選択の割合ではない。
切片(intercept)とγ、σは一つの水準が0に固定される。
0にする水準を入れ替える場合は、引数reflevelを指定する。
summary( mlogit(choice ~ vcost | income | travel, reflevel=4, data=TM) )
Call:
mlogit(formula = choice ~ vcost | income | travel, data = TM,
    reflevel = 4, method = "nr", print.level = 0)

Frequencies of alternatives:
    car     air   train     bus
0.28095 0.27619 0.30000 0.14286

nr method
5 iterations, 0h:0m:0s
g'(-H)^-1g = 7.87E-05
successive function values within tolerance limits

Coefficients :
                    Estimate Std. Error t-value  Pr(>|t|)
air:(intercept)    0.7699463  0.8161644  0.9434 0.3454908
train:(intercept)  2.4566096  0.6244004  3.9343 8.342e-05 ***
bus:(intercept)    0.9148631  0.7662845  1.1939 0.2325191
vcost             -0.0056710  0.0066967 -0.8468 0.3970894
air:income         0.0129009  0.0111799  1.1539 0.2485269
train:income      -0.0469243  0.0121817 -3.8520 0.0001171 ***
bus:income        -0.0285424  0.0129991 -2.1957 0.0281118 *
car:travel        -0.0066324  0.0011331 -5.8531 4.825e-09 ***
air:travel        -0.0367774  0.0067680 -5.4340 5.509e-08 ***
train:travel      -0.0074593  0.0011859 -6.2898 3.180e-10 ***
bus:travel        -0.0068219  0.0013397 -5.0922 3.539e-07 ***
---
Signif. codes:  0 ‘***’ 0.001 ‘**’ 0.01 ‘*’ 0.05 ‘.’ 0.1 ‘ ’ 1

Log-Likelihood: -232.48
McFadden R^2:  0.18071
Likelihood ratio test : chisq = 102.56 (p.value = < 2.22e-16)
適合度の指標に関して。
“Log-Likelihood:”は対数尤度。
“McFadden R^2:”は参考文献(B) p.124では、McFadden ρ^2 と書かれている。
“Likelihood ratio test :”は切片モデルに対する検定。
“McFadden R^2:”を計算してみる。
( ll <- summary( FitTM )$logLik )
'log Lik.' -232.4804 (df=11)
切片モデル。
FitTM0 <- mlogit(choice ~ 1, data=TM)
summary( FitTM0 )
Call:
mlogit(formula = choice ~ 1, data = TM, method = "nr", print.level = 0)

Frequencies of alternatives:
    air   train     bus     car
0.27619 0.30000 0.14286 0.28095

nr method
4 iterations, 0h:0m:0s
g'(-H)^-1g = 0.000622
successive function values within tolerance limits

Coefficients :
                   Estimate Std. Error t-value Pr(>|t|)
train:(intercept)  0.082692   0.181974  0.4544 0.649529
bus:(intercept)   -0.659237   0.224888 -2.9314 0.003374 **
car:(intercept)    0.017094   0.184907  0.0924 0.926341
---
Signif. codes:  0 ‘***’ 0.001 ‘**’ 0.01 ‘*’ 0.05 ‘.’ 0.1 ‘ ’ 1

Log-Likelihood: -283.76
McFadden R^2:  0
Likelihood ratio test : chisq = 0 (p.value = 1)
( ll0 <- summary( FitTM0 )$logLik )
'log Lik.' -283.7588 (df=3)
as.numeric( 1 - (ll / ll0) )
[1] 0.1807111
となる。
対数尤度を利用した計算からも分かるとおり、モデルに変数を加えれば加えるほど値が高くなっていくことに注意。
この指標の読み方であるが、参考文献(B)が(C)を参照している。
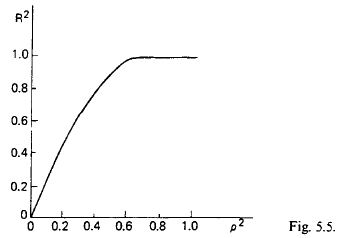
(参考文献(C) p.124より)
横軸が“McFadden R^2:”で、縦軸が通常のR^2である。
どうやって導き出したかは不明だが、経験則的にこのように判断できるとなっている。0.5程度のモデルが作れれば、十分合格点ということになるだろう。
各個人に対する、各選択肢の選択予測値は以下の操作で出力を行う。
( fitRes <- FitTM$probabilities )
# fitted(FitTM, outcome=FALSE) # これでも同じ
               air      train         bus         car
  [1,] 0.119817364 0.23053702 0.090576734 0.559068885
  [2,] 0.317031379 0.28838285 0.102175448 0.292410320
  [3,] 0.651515719 0.04527835 0.049321451 0.253884481
  [4,] 0.492368062 0.03999761 0.029395135 0.438239197
  [5,] 0.117289099 0.49291692 0.237541845 0.152252133
  [6,] 0.087258878 0.53618734 0.131474081 0.245079699
  [7,] 0.829788104 0.02232870 0.027580156 0.120303036
  [8,] 0.251498768 0.34596333 0.176161979 0.226375922
  [9,] 0.154158841 0.21992794 0.094726675 0.531186546
 [10,] 0.526192120 0.04275839 0.031663300 0.399386190
 [11,] 0.179378500 0.42617592 0.112891226 0.281554353
 [12,] 0.114347018 0.29971102 0.117604796 0.468337167
 [13,] 0.144166110 0.17389664 0.089848946 0.592088309
 [14,] 0.223915354 0.27859546 0.119081403 0.378407786
 [15,] 0.498162161 0.25977304 0.200121678 0.041943118
..... skip .....
[207,] 0.218547728 0.24899471 0.211234675 0.321222889
[208,] 0.056502916 0.56022179 0.276306236 0.106969061
[209,] 0.170163004 0.37815127 0.183175726 0.268510000
[210,] 0.405440673 0.04138912 0.057691327 0.495478876
各個人の実際の選択に対する予測値のみを返したい場合。
FitTM$fitted.values
# fitted( FitTM, outcome=TRUE ) # これでも同じ
      1.air       2.air       3.air       4.air       5.air       6.air
0.559068885 0.292410320 0.253884481 0.438239197 0.152252133 0.536187342
      7.air       8.air       9.air      10.air      11.air      12.air
0.829788104 0.226375922 0.531186546 0.399386190 0.281554353 0.468337167
     13.air      14.air      15.air      16.air      17.air      18.air
0.592088309 0.378407786 0.041943118 0.625623550 0.558350920 0.738326313
..... skip .....
    199.air     200.air     201.air     202.air     203.air     204.air
0.510837490 0.361912483 0.258362415 0.315766795 0.202403945 0.267393122
    205.air     206.air     207.air     208.air     209.air     210.air
0.166773948 0.128082868 0.218547728 0.276306236 0.268510000 0.495478876
混同行列(Confusion Matrix)を作成してみる。
標準出力にあるのかもしれないが、分からないので、選択予測確率(fitResに格納している)から作成してみる。
このfitResの各行において、最大の確率に対応する列名を取り出す関数を作成。
## fitResの各行において、maxとなる列名をまとめたvectorを返す関数
fn_findPred1 <- function(df0) {
df1 <- as.data.frame(df0)
maxLevel <- apply(df1, 1, max)
nc <- ncol(df1)
temp_return <- NULL
for(i in 1:nc) {
#print(i)
temp_col <- ifelse( df1[i]==maxLevel, names(df1[i]), "" )
#print(head(temp_col))
if(i==1){
temp_return <- temp_col
}else{
temp_return <- paste(temp_return, temp_col, sep="")
}
#print(head(temp_return))
}
return( temp_return )
}
fitResを代入して関数を実行。
( predChoiceCol <- fn_findPred1(fitRes) )
  [1] "car"   "air"   "air"   "air"   "train" "train" "air"   "train" "car"
 [10] "air"   "train" "car"   "car"   "car"   "air"   "train" "train" "train"
 [19] "train" "air"   "train" "train" "air"   "air"   "train" "air"   "air"
 [28] "train" "train" "train" "train" "train" "air"   "train" "train" "train"
..... skip .....
[181] "train" "train" "train" "train" "train" "air"   "train" "train" "car"
[190] "air"   "train" "train" "car"   "bus"   "train" "train" "train" "air"
[199] "air"   "air"   "train" "air"   "train" "train" "air"   "air"   "car"
[208] "train" "train" "car"
各個人の予測選択肢が出力される。
この予測選択による選択肢の割合を計算するには以下。
table(predChoiceCol)/210
predChoiceCol
       air        bus        car      train
0.30000000 0.04761905 0.25238095 0.40000000
各個人の実際の選択をデータ(TM)から作成。
( actChoiceCol <- as.character(TM$mode[TM$choice==TRUE]) )
  [1] "car"   "car"   "car"   "car"   "car"   "train" "air"   "car"   "car"
 [10] "car"   "car"   "car"   "car"   "car"   "car"   "train" "train" "train"
 [19] "train" "train" "train" "train" "air"   "air"   "air"   "air"   "air"
 [28] "air"   "train" "train" "train" "train" "train" "train" "train" "train"
..... skip .....
[181] "car"   "car"   "train" "train" "train" "bus"   "air"   "air"   "car"
[190] "car"   "car"   "air"   "air"   "bus"   "train" "train" "car"   "air"
[199] "air"   "air"   "bus"   "car"   "bus"   "bus"   "bus"   "car"   "air"
[208] "bus"   "car"   "car"
predChoiceColとactChoiceColでクロス集計。
( ConfMatrix <- table(actChoiceCol, predChoiceCol) )
            predChoiceCol
actChoiceCol air bus car train
       air    25   0  20    13
       bus     9  10   3     8
       car    17   0  30    12
       train  12   0   0    51
と混同行列(Confusion Matrix)が作成できる。
誤分類率を求める場合は、混同行列の対角要素を利用し、以下のように計算できる。
1 - sum(diag(ConfMatrix))/210 # 210 = #individuals
[1] 0.447619
では、変数を増やしたモデルも作成しておく。
FitTM2 <- mlogit(choice ~ wait+vcost | income+size | travel, data=TM)
summary( FitTM2 )
Call:
mlogit(formula = choice ~ wait + vcost | income + size | travel,
    data = TM, method = "nr", print.level = 0)

Frequencies of alternatives:
    air   train     bus     car
0.27619 0.30000 0.14286 0.28095

nr method
5 iterations, 0h:0m:0s
g'(-H)^-1g = 7.32E-07
gradient close to zero

Coefficients :
                    Estimate Std. Error t-value  Pr(>|t|)
train:(intercept) -2.1240906  1.2159544 -1.7469 0.0806633 .
bus:(intercept)   -3.3311281  1.3317591 -2.5013 0.0123739 *
car:(intercept)   -7.5393851  1.2585583 -5.9905 2.092e-09 ***
wait              -0.0973882  0.0113005 -8.6180 < 2.2e-16 ***
vcost             -0.0058938  0.0086924 -0.6780 0.4977476
train:income      -0.0727496  0.0172146 -4.2260 2.378e-05 ***
bus:income        -0.0333524  0.0176288 -1.8919 0.0585002 .
car:income        -0.0163247  0.0141088 -1.1571 0.2472481
train:size         1.1771968  0.3094744  3.8039 0.0001425 ***
bus:size           0.8055721  0.3962361  2.0331 0.0420464 *
car:size           1.0019958  0.2754798  3.6373 0.0002755 ***
air:travel        -0.0329873  0.0072772 -4.5330 5.816e-06 ***
train:travel      -0.0069413  0.0013858 -5.0090 5.472e-07 ***
bus:travel        -0.0067683  0.0016560 -4.0872 4.367e-05 ***
car:travel        -0.0070640  0.0012872 -5.4879 4.068e-08 ***
---
Signif. codes:  0 ‘***’ 0.001 ‘**’ 0.01 ‘*’ 0.05 ‘.’ 0.1 ‘ ’ 1

Log-Likelihood: -162.79
McFadden R^2:  0.42631
Likelihood ratio test : chisq = 241.94 (p.value = < 2.22e-16)
McFrdden R^2など大きく上昇している。
各個人における、選択肢の予測確率。
fitRes2 <- fitted(FitTM2, outcome=FALSE)
上で定義した関数を適用。
predChoiceCol2 <- fn_findPred1(fitRes2)
混同行列。
( ConfMatrix2 <- table(actChoiceCol, predChoiceCol2) )
            predChoiceCol2
actChoiceCol air bus car train
       air    40   1  14     3
       bus     5  22   2     1
       car     5   0  46     8
       train   5   1   9    48
誤分類率。
1 - sum(diag(ConfMatrix2))/210
[1] 0.2571429
実データで扱う場合は、それはそれで大変なのだが、今回は使い方メモということで…。
---------- 参考文献 ----------
(A) Estimation of multinomial logit models in R : The mlogit Packages
Yves Croissant
http://cran.r-project.org/web/packages/mlogit/vignettes/mlogit.pdf
(B) マーケティングのデータ分析―分析手法と適用事例
岡太彬訓, 守口剛
http://www.asakura.co.jp/books/isbn/978-4-254-12822-2/
(C) Urban Travel Demand: A Behavioral Analysis
Tom Domencich, Daniel L. McFadden
http://eml.berkeley.edu/~mcfadden/travel.html
Ch.5
http://eml.berkeley.edu/~mcfadden/travel/ch5.pdf
リッジ/Ridge回帰、Lasso回帰、Elastic Net (R - glmnet)
リッジ/Ridge回帰、Lasso回帰、Elastic Net に関して。
まず、モデルの複雑性とオーバーフィッティングに関して復習メモ。
複雑なモデル: バイアス(Bias)が小さく、バリアンス(Variance)が大きい
シンプルなモデル: バイアスが大きく、バリアンスが小さい
バイアスと言うのは、モデルによる予測値の平均が真の値からどれくらい乖離しているかの指標。小さいほうが良い。
バリアンスと言うのは、モデルの予測値自体のばらつき。予測の安定性みたいなもの。小さいほうが良い。
バイアスとバリアンスはトレードオフ関係にあり、モデル作成の際には複雑なモデルとシンプルなモデルの間の、ほどよく複雑なモデル(結果的に予測精度が高くなるモデル)を選ぶ必要がある。
各統計モデルによって、どのようにこの複雑性を調整するかが異なる。
例えば、重回帰であれば、説明変数を全部入れるだとか、たくさん入れると複雑なモデルになり、ステップワイズ法などにより少数の選択された説明変数のみを入れれば、シンプルなモデルになる。
|
モデル |
複雑性の調整方法 |
|
重回帰 |
投入する変数の数。多いと複雑。少ないとシンプル。 |
|
主成分回帰 |
作成する主成分の数。多いと複雑。少ないとシンプル。(主成分数=変数の数、が最大。この場合、全変数投入の重回帰に一致。) |
|
PLS |
作成する因子の数(因子数=変数の数、が最大。この場合、全変数投入の重回帰に一致。) |
|
ツリー(線形モデルでない) |
分岐する枝の数。多いと複雑。少ないとシンプル。 |
|
Ridge回帰 |
λ(Complexity Parameter)の大きさ。小さいと複雑。大きいとシンプル(Shrinkageが大きい)。 |
|
Lasso回帰 |
λ(Complexity Parameter)の大きさ。小さいと複雑。大きいとシンプル(Shrinkageが大きい)。 |
では、Ridge回帰、Lasso回帰、Elastic Netの説明。
Ridge回帰、Lasso回帰に関しては、参考文献(a)に詳しい説明がある。
例えば、p.64- には、主成分分析(特異値分解)と関連させてRidge回帰の係数の推定の特徴が説明されていたりと、興味深い。
これら3つのモデルはどれも線形回帰で、パラメータβは、以下の式によって推定される。

(参考文献(c), p.3 より)
式(2)(と(3))が、ペナルティである。
α= 0 とした場合、Ridge回帰となる。
α= 1 とした場合、Lasso回帰となる。
0 < α< 1 の場合、Elastic Netである。
λはComplexity Parameterと呼ばれ、λが0だと、通常の最小二乗法に一致する。
パラメータβは式(1)から分かるとおり、大きいとペナルティの影響が強くなるので、パラメータβが小さく推定される。
このλにより、モデルの複雑性が調整される。小さいと複雑、大きいとシンプル(Shrinkageが大きい)なモデルとなる。
では、Rのglmnetパッケージを使ってみる。
library(glmnet)
外部データをインポート。
JMPのDiabetesデータを使用した。
LARSパッケージに、diabetesというデータがあるらしいが、おそらく同じものでないかと思う。
LASSO and Ridge regression - iAnalysis 〜おとうさんの解析日記〜
では、このデータを用いて同手法を説明しているが、このサンプルデータのデータ構造が良く分からないので、持ちデータをインポートして使用する。
data1に読み込んだデータを格納。
head(data1, 15)
     Y Age Gender  BMI  BP Total.Cholesterol   LDL HDL  TCH    LTG Glucose Validation
1  151  59      2 32.1 101               157  93.2  38 4.00 4.8598      87   Training
2   75  48      1 21.6  87               183 103.2  70 3.00 3.8918      69 Validation
3  141  72      2 30.5  93               156  93.6  41 4.00 4.6728      85   Training
4  206  24      1 25.3  84               198 131.4  40 5.00 4.8903      89   Training
5  135  50      1 23.0 101               192 125.4  52 4.00 4.2905      80   Training
6   97  23      1 22.6  89               139  64.8  61 2.00 4.1897      68   Training
7  138  36      2 22.0  90               160  99.6  50 3.00 3.9512      82   Training
8   63  66      2 26.2 114               255 185.0  56 4.55 4.2485      92 Validation
9  110  60      2 32.1  83               179 119.4  42 4.00 4.4773      94   Training
10 310  29      1 30.0  85               180  93.4  43 4.00 5.3845      88   Training
11 101  22      1 18.6  97               114  57.6  46 2.00 3.9512      83 Validation
12  69  56      2 28.0  85               184 144.8  32 6.00 3.5835      77   Training
13 179  53      1 23.7  92               186 109.2  62 3.00 4.3041      81   Training
14 185  50      2 26.2  97               186 105.4  49 4.00 5.0626      88 Validation
15 118  61      1 24.0  91               202 115.4  72 3.00 4.2905      73   Training
str(data1)
'data.frame':   442 obs. of  12 variables:
 $ Y                : int  151 75 141 206 135 97 138 63 110 310 ...
 $ Age              : int  59 48 72 24 50 23 36 66 60 29 ...
 $ Gender           : int  2 1 2 1 1 1 2 2 2 1 ...
 $ BMI              : num  32.1 21.6 30.5 25.3 23 22.6 22 26.2 32.1 30 ...
 $ BP               : num  101 87 93 84 101 89 90 114 83 85 ...
 $ Total.Cholesterol: int  157 183 156 198 192 139 160 255 179 180 ...
 $ LDL              : num  93.2 103.2 93.6 131.4 125.4 ...
 $ HDL              : num  38 70 41 40 52 61 50 56 42 43 ...
 $ TCH              : num  4 3 4 5 4 2 3 4.55 4 4 ...
 $ LTG              : num  4.86 3.89 4.67 4.89 4.29 ...
 $ Glucose          : int  87 69 85 89 80 68 82 92 94 88 ...
 $ Validation       : Factor w/ 2 levels "Training","Validation": 1 2 1 1 1 1 1 2 1 1 ...
glmnet() 関数を使用するが、目的、説明変数はnumeric型のmatrixでないとエラーが出るので、変換しておく。カテゴリー型の変数は直接扱えない。
intをnumに変換したdata3を作る。
data3 <- data1
lstCol <- length(data1)
c_num <- 1
for(clm in data3[1:(lstCol-1)]){
data3[c_num] <- as.numeric(clm)
c_num <- c_num + 1
}
str(data3)
'data.frame':   442 obs. of  12 variables:
 $ Y                : num  151 75 141 206 135 97 138 63 110 310 ...
 $ Age              : num  59 48 72 24 50 23 36 66 60 29 ...
 $ Gender           : num  2 1 2 1 1 1 2 2 2 1 ...
 $ BMI              : num  32.1 21.6 30.5 25.3 23 22.6 22 26.2 32.1 30 ...
 $ BP               : num  101 87 93 84 101 89 90 114 83 85 ...
 $ Total.Cholesterol: num  157 183 156 198 192 139 160 255 179 180 ...
 $ LDL              : num  93.2 103.2 93.6 131.4 125.4 ...
 $ HDL              : num  38 70 41 40 52 61 50 56 42 43 ...
 $ TCH              : num  4 3 4 5 4 2 3 4.55 4 4 ...
 $ LTG              : num  4.86 3.89 4.67 4.89 4.29 ...
 $ Glucose          : num  87 69 85 89 80 68 82 92 94 88 ...
 $ Validation       : Factor w/ 2 levels "Training","Validation": 1 2 1 1 1 1 1 2 1 1 ...
data.frameをmatrixにする。
Gender 、BMI、BP、Total.Cholesterol、LDL、HDL、TCH、LTG、Glucoseの9変数を説明変数とする。
exp_vars <- as.matrix(data3[3:11])
Yを目的変数。
target_var <- as.matrix(data3[1])
Ridge回帰を実行してみる。
fitRidge1 <- glmnet( x=exp_vars, y=target_var, family="gaussian", alpha=0 )
上でも説明したが、α=0の時がRidgeである。
fitRidge1$betaを実行すると、各Complexity Parameter(λ)におけるパラメータ推定値が確認できる。
デフォルトで、λは100分割されるように設定されている。nlambda引数に値を指定することにより、変更も可能なようである。
lambda.min.ratio引数で、どの程度の幅で分割するかを決められるようである。
fitRidge1$lambda[i-1] / fitRidge1$lambda[i] = 1.097499
1.097499^99 = 10000.21
(1.097499^99) * 0.0001 = 1.000021
0.0001は、glmnet()の引数であるlambda.min.ratioで指定される。
マニュアル(参考文献(b))によれば、family="gaussian"は最小2乗法、それ以外の分布の場合は最尤法で行われるとのこと。
では、ペナルティと推定値のグラフ。
plot(fitRidge1, xvar="norm", label=TRUE)
label=TRUE 番号ラベルを付ける。

ラベルの凡例は以下。
1 Gender
2 BMI
3 BP
4 Total.Cholesterol
5 LDL
6 HDL
7 TCH
8 LTG
9 Glucose
軸上の目盛はnon zeroの変数の数。Ridgeはいずれも0にならない。
軸下の目盛、”L1 Norm”の意味はよく分からない。範囲は0-80となっている。
このグラフの方が有名だと思うが、横軸をλ(log(λ))とする場合も描いてみる。
plot(fitRidge1, xvar="lambda", label=TRUE)

この方がλとしているので、違和感なければ、こちらの方が見やすい気がする。
クロスバリデーションによって、最適なλを決定する。要するに、上で説明した、最適なモデルの複雑性をクロスバリデーションによって決定する、と言うことである。
cv.glmnet()で実施。デフォルトの分割数は10分割とのこと。任意の数を指定したい場合は引数nfoldsで指定する。
fitRidgeCV1 <- cv.glmnet( x=exp_vars, y=target_var, family="gaussian", alpha=0 )
MSEのプロット。
plot(fitRidgeCV1)

左側の縦点線が、MSEが最小となるときのλの対数となる。
min(fitRidgeCV1$cvm)
3034.586
fitRidgeCV1$lambda.min
4.516003
log(fitRidgeCV1$lambda.min)
1.507627
右側の点線が、上のMSEが最小となるときのMSEの上側1seとなるときのλの対数。
選ばれたλを、ペナルティと推定値のグラフに描き入れてみる。
plot(fitRidge1, xvar="lambda", label=TRUE)
abline(v=log(fitRidgeCV1$lambda.min), lty=2)

MSEが最小となる時のλに対応するパラメータを出力するときは以下。
coef(fitRidgeCV1, s="lambda.min")
10 x 1 sparse Matrix of class "dgCMatrix"
                              1
(Intercept)       -235.51985766
Gender             -20.86494597
BMI                  5.43730943
BP                   1.06492509
Total.Cholesterol   -0.16518308
LDL                 -0.07801274
HDL                 -0.66474289
TCH                  4.19250608
LTG                 43.08980263
Glucose              0.33275805
MSEが最小となるときのMSEの上側1seとなるときのλに対応するパラメータを出力するときは以下。
coef(fitRidgeCV1, s="lambda.1se")
10 x 1 sparse Matrix of class "dgCMatrix"
                              1
(Intercept)       -1.482047e+02
Gender            -9.306175e+00
BMI                3.600844e+00
BP                 7.589827e-01
Total.Cholesterol  1.217223e-03
LDL               -6.034893e-02
HDL               -5.886791e-01
TCH                4.431805e+00
LTG                2.618412e+01
Glucose            4.785016e-01
推定したパラメータによる予測値を求める場合は以下。
pred_fitRidgeCV1 <- predict(fitRidgeCV1, s="lambda.min", newx=exp_vars)
glmnetでは、パラメータ推定の際に一度スケーリングが行われ、推定後に元のスケールに戻される処理が行われていることに注意。
Lasso回帰のあてはめ。
fitLasso1 <- glmnet( x=exp_vars, y=target_var, family="gaussian", alpha=1 )
glmnetで引数alpha=1と指定する。
Lidgeと同様にCVを実行。
fitLassoCV1 <- cv.glmnet( x=exp_vars, y=target_var, family="gaussian", alpha=1 )
MSEのプロット。
plot(fitLassoCV1)

上軸のラベルを見ると、λが大きくなるにつれてnon zero変数が減っていっているのが分かる。
各点線の位置。
MSEが最小。
log(fitLassoCV1$lambda.min)
-2.236981
1 SEの位置。
log(fitLassoCV1$lambda.1se)
1.949538
ペナルティと推定値のグラフにラインを加えたもの。
plot(fitLasso1, xvar="lambda", label=TRUE)
abline(v=log(fitLassoCV1$lambda.min), lty=2)

λが最小となる時の、パラメータ推定値。
coef(fitLassoCV1, s="lambda.min")
10 x 1 sparse Matrix of class "dgCMatrix"
                              1
(Intercept)       -297.31652686
Gender             -22.36620204
BMI                  5.63820180
BP                   1.09805284
Total.Cholesterol   -0.71269983
LDL                  0.40363399
HDL                 -0.06213511
TCH                  5.31599377
LTG                 59.15181902
Glucose              0.27136481
予測の場合もRidgeと同様に。
pred_fitLassoCV1 <- predict(fitLassoCV1, s="lambda.min", newx=exp_vars)
Elastic Netも同様に実行してみる。
fitEN1 <- glmnet( x=exp_vars, y=target_var, family="gaussian", alpha=0.5 )
alpha=0.5としてとりあえず実行。
CVの実行。αが自動的に決定されるわけではない。
fitENCV1 <- cv.glmnet( x=exp_vars, y=target_var, family="gaussian", alpha=0.5 )
CVによるMSEのプロット。
plot(fitENCV1)

MSEが最小。
log(fitENCV1$lambda.min)
-3.776643
ペナルティと推定値のグラフにラインを加えたもの。
plot(fitEN1, xvar="lambda", label=TRUE)
abline(v=log(fitENCV1$lambda.min), lty=2)
予測値。
pred_fitENCV1 <- predict(fitENCV1, s="lambda.min", newx=exp_vars)
これらの手法の違いだが、JMPマニュアルに簡潔な記述があったので、それを引用しておく。
----- ここから -----
JMP Pro の「モデルのあてはめ」プラットフォームで提供されている「一般化回帰」手法は、パラメータ推定値を収縮(shrink)させた回帰分析を行います。この手法は、相関の高い説明変数が多数あるようなデータで役立ちます。用意されている方法のうち、Lasso と弾性ネットは、パラメータ推定値を収縮させるだけでなく、変数選択を行う側面もあります。
相関の高い説明変数が多数あるデータでは、一般的に、多重共線性の問題が生じます。最近のデータには、標本サイズよりも変数の数の方が多いこともよくあります。そのような場合は、変数を選択する必要があります。しかし、多重共線性や説明変数が多数あることにより、従来の方法ではうまく分析できないことがあります。
実験計画などの、小規模で相関があまりないようなデータでも、Lasso や弾性ネットは役立ちます。予測モデルの予測精度を上げる場合や、モデルに含める変数を選択する場合に役立ちます。
「一般化回帰」手法は、正則化した(罰則を課した)回帰分析を行います。正則化した回帰分析では、パラメータ推定値をゼロの方向に収縮(shrink)することで、モデルの予測精度を高めようとします。正則化によりパラメータ推定値を収縮させると、予測値にはバイアスが生じます。バイアスは増加するのですが、それと引き換えに、ばらつき(分散)が減れば、全体として予測誤差は小さくなります。
Lasso には2 つの欠点があります。第1 に、同じ程度に重要な変数のあいだに高い相関がある場合、Lasso はそこから変数を1 つだけしか選択しない傾向があります。第2 に、変数の個数p が標本サイズnよりも多い場合、Lasso は最大でn個しか説明変数を選択しません。
一方、弾性ネットは、重要な変数間に高い相関があっても、そこから複数の変数を選択しようとします。また、弾性ネットは、n < p のとき、n 個以上の説明変数を選択することもできます。ただし、弾性ネットは、通常、Lasso よりも計算時間が長くなります。
リッジ回帰は、罰則を課す回帰手法の中では初期のものの1 つです(Hoerl, 1962, Hoerl and Kennard,1970)。リッジ手法は係数を0 に収縮しないので、変数の選択は行いません。
「一般化回帰」手法では、Lasso と弾性ネットにおいて、適応型推定 (Adaptive Lasso) も行えます。適応型推定では、効果のある変数に対して、効果があまりない変数より少ない罰則が課されます。適応型推定は、モデルが預言的性質(oracle property)をもつようにするために提案されました。預言的性質とは、漸近的には効果のある説明変数がきちんと選択されるという性質です。より具体的には、次のような性質をもつことを指します。
? パラメータがゼロである説明変数を正確に識別すること。
? 得られるパラメータ推定値が、効果のある説明変数だけを使って構成したモデルのパラメータ推定値に、漸近的に一致すること。
----- ここまで -----
では、この記述のいくつかを試すため、70行のサンプルデータを作り、シミュレーションしてみる。
x1_1、x1_2、x1_3で高い相関を持たせる。
x1_1 <- rnorm(70)
x1_2 <- 0.9*x1_1 + 0.2*rnorm(70)
x1_3 <- 0.7*x1_1 + 0.2*rnorm(70)
x2_1、x2_2、x2_3で高い相関を持たせる。
x2_1 <- rnorm(70)
x2_2 <- 0.9*x2_1 + 0.2*rnorm(70)
x2_3 <- 0.7*x2_1 + 0.2*rnorm(70)
x3、x4は独立。
x3 <- rnorm(70)
x4 <- rnorm(70)
yを以下のように線形結合する。
y <- 0.7*x1_1 + 0.1*x2_1 + 0.7*x3 + 0.1*x4
cor(cbind(x1_1, x1_2, x1_3, x2_1, x2_2, x2_3, x3, x4, y))
          x1_1      x1_2      x1_3       x2_1       x2_2        x2_3         x3          x4         y
x1_1 1.0000000 0.9798883 0.9633291 0.29446205 0.30760303 0.269618825 0.28359103 0.273269025 0.8259803
x1_2 0.9798883 1.0000000 0.9424121 0.27852622 0.28981647 0.246803991 0.26735420 0.266495332 0.8023936
x1_3 0.9633291 0.9424121 1.0000000 0.24517903 0.25446480 0.208568264 0.29483674 0.237208146 0.8025598
x2_1 0.2944620 0.2785262 0.2451790 1.00000000 0.98061893 0.958538880 0.10406548 0.019824971 0.3218394
x2_2 0.3076030 0.2898165 0.2544648 0.98061893 1.00000000 0.941537391 0.06121275 0.015564267 0.3033108
x2_3 0.2696188 0.2468040 0.2085683 0.95853888 0.94153739 1.000000000 0.09870941 0.004176373 0.2987194
x3   0.2835910 0.2673542 0.2948367 0.10406548 0.06121275 0.098709407 1.00000000 0.064414685 0.7632235
x4   0.2732690 0.2664953 0.2372081 0.01982497 0.01556427 0.004176373 0.06441468 1.000000000 0.3026419
y    0.8259803 0.8023936 0.8025598 0.32183941 0.30331081 0.298719414 0.76322353 0.302641884 1.0000000
yはx1グループとx3と強い相関を持つ。
このデータに3手法を適用してみる。
all_x <- cbind(x1_1, x1_2, x1_3, x2_1, x2_2, x2_3, x3, x4)
Ridge回帰。
cvRidge <- cv.glmnet( x=all_x, y=y, family="gaussian", alpha=0 )
Lasso回帰。
cvLasso <- cv.glmnet( x=all_x, y=y, family="gaussian", alpha=1 )
Elastic Net(α=0.5)。
cvEN <- cv.glmnet( x=all_x, y=y, family="gaussian", alpha=0.5 )
Elastic Net(α=0.1)。
cvEN2 <- cv.glmnet( x=all_x, y=y, family="gaussian", alpha=0.1 )
これら4つのグラフを作成。
par(mfrow=c(2,2))
plot(cvRidge$glmnet.fit, xvar="lambda", label=TRUE, main="Ridge")
abline(v=log(cvRidge$lambda.min), lty=2)
plot(cvLasso$glmnet.fit, xvar="lambda", label=TRUE, main="Lasso")
abline(v=log(cvLasso$lambda.min), lty=2)
plot(cvEN$glmnet.fit, xvar="lambda", label=TRUE, main="Elastic Net, α=0.5")
abline(v=log(cvEN$lambda.min), lty=2)
plot(cvEN2$glmnet.fit, xvar="lambda", label=TRUE, main="Elastic Net, α=0.1")
abline(v=log(cvEN2$lambda.min), lty=2)

ラベルの凡例は以下。
1, 2, 3 = x1_1, x1_2, x1_3
4, 5, 6 = x2_1, x2_2, x2_3
7 = x3
8 = x4
Ridge回帰。
x1、x2はグループ内で固まっている。
また、x1はグループでyへの影響を分け合っているような形で推定値が出ている。
# coef(cvRidge, s="lambda.min")
Lasso回帰。
x1、x2はグループ内からyとの相関が強いものが極端に選ばれる形でパラメータ推定される。
# coef(cvLasso, s="lambda.min")
Elastic Net(α=0.5)。
グループから一つだけ変数が選ばれる傾向は、Lassoに近い推定が行われているようである。
# coef(cvEN, s="lambda.min")
Elastic Net(α=0.1)。
α=0.1と小さくしたが、これでもα=0.5に近い推定のようである。
# coef(cvEN2, s="lambda.min")
--------------------- 参考文献 ---------------------
(a) The Elements of Statistical Learning: Data Mining, Inference, and Prediction.
Trevor Hastie
Robert Tibshirani
Jerome Friedman
http://statweb.stanford.edu/~tibs/ElemStatLearn/
(b) ‘glmnet’ マニュアル
http://cran.r-project.org/web/packages/glmnet/glmnet.pdf
(c) Regularization Paths for Generalized Linear Models via Coordinate Descent
Jerome Friedman
Trevor Hastie
Rob Tibshirani
(d) JMPマニュアル
http://www.jmp.com/japan/training/jmp_manual.shtml
状態空間モデル - R dlm (5)
今回は回帰モデルを扱う。これを用いることにより、説明変数を時系列データのモデリングに含めることができるようになる。
x1 <- rnorm(50)
x2 <- 0.3*x1 + rnorm(50)
y1 <- 10*x1 + 5*x2 + rnorm(50)
d1 <- data.frame(time=1:50, x1, x2, y1)
par(mfrow = c(3, 1))
plot(x=d1$time, y=d1$x1, type="o")
plot(x=d1$time, y=d1$x2, type="o")
plot(x=d1$time, y=d1$y1, type="o")

このような時系列データ(x1、x2、y1)があった場合、x1とx2によって、y1を説明したい場合に有用である。
まず簡単な、回帰モデル(説明変数2つ)で説明。上のデータの場合に対応。
以下が、説明変数2つの回帰モデル。
y[t] = β0[t] +β1[t] x1[t] +β2[t] x2[t] + v[t], v[t]~N(0, σ2)
βi[t] = βi[t-1] + wi[t], wi~N(0, w_i) i=0,1,2
x1、x2は、通常の回帰モデルと同様、確率変数でない。通常の回帰モデルと、この時系列の回帰モデルの違いは、係数β1、β1、β2が時間的に変化して行くことにある。
動的線形モデルで表現する場合、各要素は以下になる。
t=0, θ[0]~N(m[0], C[0])
t>0, Y[t] = Fθ[t] + v[t], v[t]~N(0, V) 観測値
θ[t] = Gθ[t-1] + w[t], w[t]~N(0, W) 状態

例。
dlmModReg(X=d1[2:3], dV=3, dW=c(1,4,5))
$FF
     [,1] [,2] [,3]
[1,]    1    1    1

$V
     [,1]
[1,]    3

$GG
     [,1] [,2] [,3]
[1,]    1    0    0
[2,]    0    1    0
[3,]    0    0    1

$W
     [,1] [,2] [,3]
[1,]    1    0    0
[2,]    0    4    0
[3,]    0    0    5

$JFF
     [,1] [,2] [,3]
[1,]    0    1    2

$X
     x1      x2
[1,] -0.7554 -0.5918
[2,] -1.32   1.552
[3,] ...

$m0
[1] 0 0 0

$C0
      [,1]  [,2]  [,3]
[1,] 1e+07 0e+00 0e+00
[2,] 0e+00 1e+07 0e+00
[3,] 0e+00 0e+00 1e+07
では、ローカルレベルモデル + 回帰モデル(説明変数2つ)の場合は。
回帰モデルのβ0が、ローカルレベルモデルに対応するので実際には意味がないが、動的線形モデル表現の練習のために書いてみる。
y[t] = μ[t] + β0[t] +β1[t] x1[t] +β2[t] x2[t] + v[t], v[t]~N(0, σ2)
μ[t] = μ[t] + w[t], w[t] ~N(0, w_l)
βi[t] = βi[t-1] + wi[t], wi[t]~N(0, w_i) i=0,1,2
動的線形モデルで表現する場合、各要素は以下になる。
t=0, θ[0]~N(m[0], C[0])
t>0, Y[t] = Fθ[t] + v[t], v[t]~N(0, V) 観測値
θ[t] = Gθ[t-1] + w[t], w[t]~N(0, W) 状態

これまで見てきたのと同じように、要素の分解を行うことができる。Fの一番左の要素、GとWは一番左上の要素がローカルレベルモデル部分に対応する。
例。
dlmModPoly(order=1, dV=0.5, dW=0.75) + dlmModReg(X=d1[2:3], dV=3, dW=c(1,4,5))
$FF
     [,1] [,2] [,3] [,4]
[1,]    1    1    1    1

$V
     [,1]
[1,]  3.5

$GG
     [,1] [,2] [,3] [,4]
[1,]    1    0    0    0
[2,]    0    1    0    0
[3,]    0    0    1    0
[4,]    0    0    0    1

$W
     [,1] [,2] [,3] [,4]
[1,] 0.75    0    0    0
[2,] 0.00    1    0    0
[3,] 0.00    0    4    0
[4,] 0.00    0    0    5

$JFF
     [,1] [,2] [,3] [,4]
[1,]    0    0    1    2

$X
     x1      x2
[1,] -0.7554 -0.5918
[2,] -1.32   1.552
[3,] ...

$m0
[1] 0 0 0 0

$C0
      [,1]  [,2]  [,3]  [,4]
[1,] 1e+07 0e+00 0e+00 0e+00
[2,] 0e+00 1e+07 0e+00 0e+00
[3,] 0e+00 0e+00 1e+07 0e+00
[4,] 0e+00 0e+00 0e+00 1e+07
$Fの場合は左から一つ目部分、$GGや$Wは一番左上の要素がローカルモデル部分である。
Rの出力では、$FFは、回帰の説明変数になっている部分は1となっている。回帰を含めると$JFFというのが出てくるが、詳細は不明。
では、季節要素モデル + 回帰モデル(説明変数2つ)でサンプルデータを作成してみる。
以下のモデルから出力されたサンプルデータを作成とする。
dlmModSeas(frequency=4, dV=0.5, dW=c(0.75,0,0)) + dlmModReg(X=d1[2:3], dV=1.5, dW=c(1,1.6,2.3))
サンプル数は50。
alpha1 <- 3
alpha2 <- 9
alpha3 <- -4
alpha4 <- -alpha1 -alpha2 -alpha3 # -8
seas <- c(alpha1, alpha2, alpha3, alpha4)
V <- 1.5+0.5
w_seas <- 0.75
w_reg <- c(1,1.6,2.3)
tm <- c(0)
alpha <- c(NA)
beta0 <- c(0)
beta1 <- c(0)
beta2 <- c(0)
y <- c(NA)
# 50サンプル
for(i in 1:50){
tm <- append(tm, i)
alpha_next <- seas[i%%4+1] + rnorm(1, mean=0, sd=sqrt(w_seas))
alpha <- append(alpha, alpha_next)
beta0_next <- beta0[i] + rnorm(1, mean=0, sd=sqrt(w_reg[1]))
beta0 <- append(beta0, beta0_next)
beta1_next <- beta1[i] + rnorm(1, mean=0, sd=sqrt(w_reg[2]))
beta1 <- append(beta1, beta1_next)
beta2_next <- beta2[i] + rnorm(1, mean=0, sd=sqrt(w_reg[3]))
beta2 <- append(beta2, beta2_next)
y_next <- alpha_next + beta0_next + beta1_next*x1[i] + beta2_next*x2[i] + rnorm(1, mean=0, sd=sqrt(V))
y <- append(y, y_next)
}
x1a <- c(NA,x1)
x2a <- c(NA,x2)
df1 <- data.frame(time=tm, alpha=alpha, beta0=beta0, x1=x1a, beta1=beta1, x2=x2a, beta2=beta2, y=y)
プロット。
# 4*2分割でプロット
par(mfrow = c(4, 2))
plot(x=df1$time, y=df1$alpha, type="o")
plot(x=df1$time, y=df1$x1, type="o")
plot(x=df1$time, y=df1$beta0, type="o")
abline(h=0, lty=2)
plot(x=df1$time, y=df1$x2, type="o")
plot(x=df1$time, y=df1$beta1, type="o")
abline(h=0, lty=2)
plot(x=df1$time, y=df1$y, type="o")
plot(x=df1$time, y=df1$beta2, type="o")
abline(h=0, lty=2)

これまでの流れの通り、関数を定義し、MLEでパラメータ推定。
# fn定義
fn_mod1 <- function(parm) {
V <- parm[1]
w_seas <- parm[2]
w_0 <- parm[3]
w_1 <- parm[4]
w_2 <- parm[5]
return( dlmModSeas(frequency=4, dV=exp(V), dW=c(exp(w_seas),0,0)) + dlmModReg(X=d1[2:3], dV=0, dW=c(exp(w_0),exp(w_1),exp(w_2))) )
}
# parm = c( log(V), log(w_seas), log(w_0), log(w_1), log(w_2) )
# X: n*2
# 推定
parm_start <- c(10*runif(1), 10*runif(1), 10*runif(1), 10*runif(1), 10*runif(1))
res_fn_mod1 <- dlmMLE(y=df1$y[-1], parm=parm_start, build=fn_mod1)
( V_est <- exp(res_fn_mod1$par[1]) ) # ans: 1.5+0.5=2
1.355866
( w_seas_est <- exp(res_fn_mod1$par[2]) ) # ans: 0.75
0.4222892
( w_0_est <- exp(res_fn_mod1$par[3]) ) # ans: 1
0.1048544
( w_1_est <- exp(res_fn_mod1$par[4]) ) # ans: 1.6
2.159517
( w_2_est <- exp(res_fn_mod1$par[5]) ) # ans: 2.3
0.3573823
今回はエラーも出ることなく値も安定しており、また、推定値も真の値から大きく異なることない結果が返ってくる。β0とβ2がやや小さいようである。
推定したパラメータによるカルマンスムーサーの実行。
# 推定したパラメータを関数に代入
mod1_est <- fn_mod1( res_fn_mod1$par )
# フィルタリング
fit_mod1_est <- dlmSmooth(dropFirst(df1$y), mod1_est)
str( fit_mod1_est, 1 )
List of 3
 $ s  : num [1:51, 1:6] 4.27 10.29 -5.92 -8.64 4.45 ...
 $ U.S:List of 51
 $ D.S: num [1:51, 1:6] 2.81 2.44 2.21 1.85 1.64 ...
必要なのは$sの1、4、5、6列。
alpha_est <- fit_mod1_est$s[,1]
beta0_est <- fit_mod1_est$s[,4]
beta1_est <- fit_mod1_est$s[,5]
beta2_est <- fit_mod1_est$s[,6]
yの推定値を計算。
y_est <- alpha_est + beta0_est + beta1_est*x1a + beta2_est*x2a
データフレームにまとめる。
df2 <- data.frame( df1[1:2], alpha_est, df1[3], beta0_est, df1[4:5], beta1_est, df1[6:7], beta2_est, df1[8], y_est )
head(df2)
  time     alpha alpha_est     beta0 beta0_est          x1      beta1
1    0        NA  4.272656  0.000000 0.4634815          NA  0.0000000
2    1  8.138018 10.286522 -1.224692 0.4634815  0.59047979  0.2163145
3    2 -3.478060 -5.923984 -1.498450 0.4184211 -0.08259835  0.6751069
4    3 -7.006637 -8.635194 -1.214040 0.4127776  0.04707254 -0.1822476
5    4  2.311228  4.454132  1.374272 0.4162269  1.45996620 -0.8441979
6    5  8.872011  9.764824  2.155021 0.4518083  0.16616192 -0.4990168
   beta1_est         x2      beta2 beta2_est         y     y_est
1  0.2835804         NA  0.0000000  1.388990        NA        NA
2  0.2835805 -0.6922756 -2.4077708  1.388990 10.538561  9.955888
3 -0.2644056  0.8080324 -0.6270543  1.495312 -4.785160 -4.275463
4 -0.8794455  0.2187214  0.8822229  1.710190 -8.007337 -7.889760
5 -1.4856702  0.2016472  2.2524059  1.931846  2.675382  3.090882
6 -1.1257253  0.1435495  3.2286180  2.175587 10.438714 10.341884
プロット。
# 4*2分割でプロット
par(mfrow = c(4, 2))
yl = c(min(na.omit(df2$alpha))-1, max(na.omit(df2$alpha))+1)
plot(x=df2$time, y=df2$alpha, ylim=yl, type="o")
par(new=TRUE)
plot(x=df2$time, y=df2$alpha_est, ylim=yl, type="o", col="blue", ylab="")
plot(x=df2$time, y=df2$x1, type="o")
yl = c(min(na.omit(df2$beta0))-1, max(na.omit(df2$beta0))+1)
plot(x=df2$time, y=df2$beta0, ylim=yl, type="o")
par(new=TRUE)
plot(x=df2$time, y=df2$beta0_est, ylim=yl, type="o", col="blue", ylab="")
abline(h=0, lty=2)
plot(x=df2$time, y=df2$x2, type="o")
yl = c(min(na.omit(df2$beta1))-1, max(na.omit(df2$beta1))+1)
plot(x=df2$time, y=df2$beta1, ylim=yl, type="o")
par(new=TRUE)
plot(x=df2$time, y=df2$beta1_est, ylim=yl, type="o", col="blue", ylab="")
abline(h=0, lty=2)
yl = c(min(na.omit(df2$y))-1, max(na.omit(df2$y))+1)
plot(x=df2$time, y=df2$y, ylim=yl, type="o")
par(new=TRUE)
plot(x=df2$time, y=df2$y_est, ylim=yl, type="o", col="blue", ylab="")
yl = c(min(na.omit(df2$beta2))-1, max(na.omit(df2$beta2))+1)
plot(x=df2$time, y=df2$beta2, ylim=yl, type="o")
par(new=TRUE)
plot(x=df2$time, y=df2$beta2_est, ylim=yl, type="o", col="blue", ylab="")
abline(h=0, lty=2)

青が推定値となる。
前に季節要素モデルを取り上げたときと同様。季節要素alphaはだいたい綺麗に推定できるようである。
β0とβ2の推定された分散が真の分散より小さかったので、実際より滑らかになっている。ただし、傾向はそれなりに捉えているように思う。